
Company Introduction
Data Analysis Business Area Diagram – Visualization of Business Dynamics
RJ0400063_10
- Last Update 12/21/2025
- File Size 0.4MB
- # of Slides 2
- File Format PPTX
- Slide Ratio 16:9
- Color
Keywords
About the Product
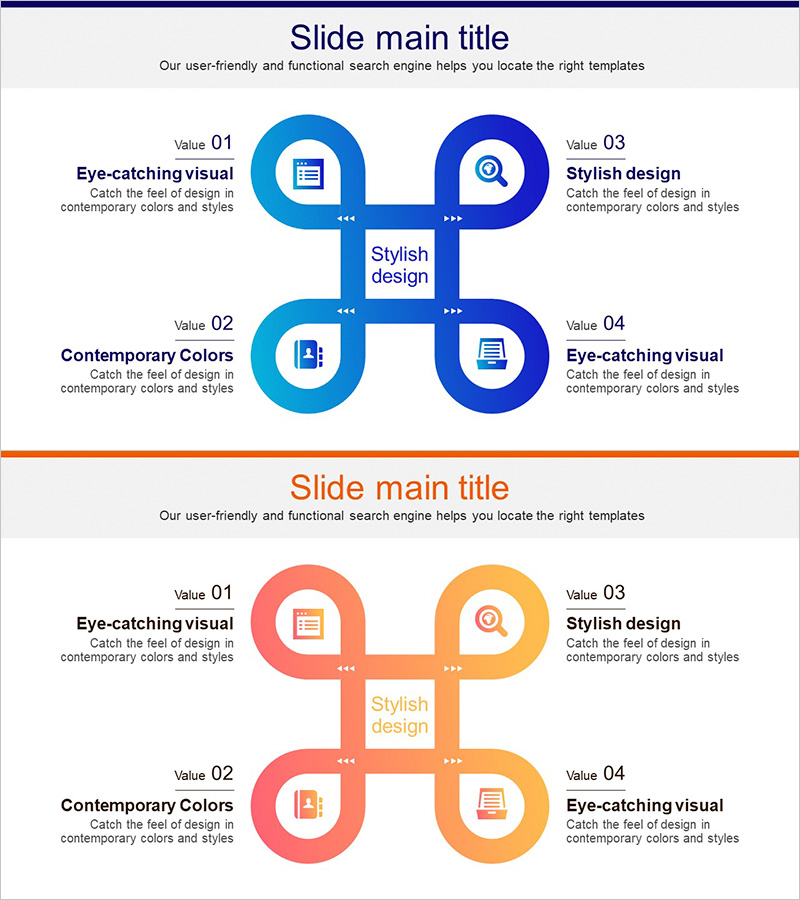
This slide features a non-central diagram that visualizes various business areas centered around data analysis. It distinctly conveys information using icons and color differentiation, making it ideal for company profiles or business strategy presentations. The layout places key information in the center with related items surrounding it, simplifying complex content. The blue and red color scheme exudes both reliability and dynamism. Text and graphic elements are easily replaceable, rated at an 'easy' editing level.
Related Products
-
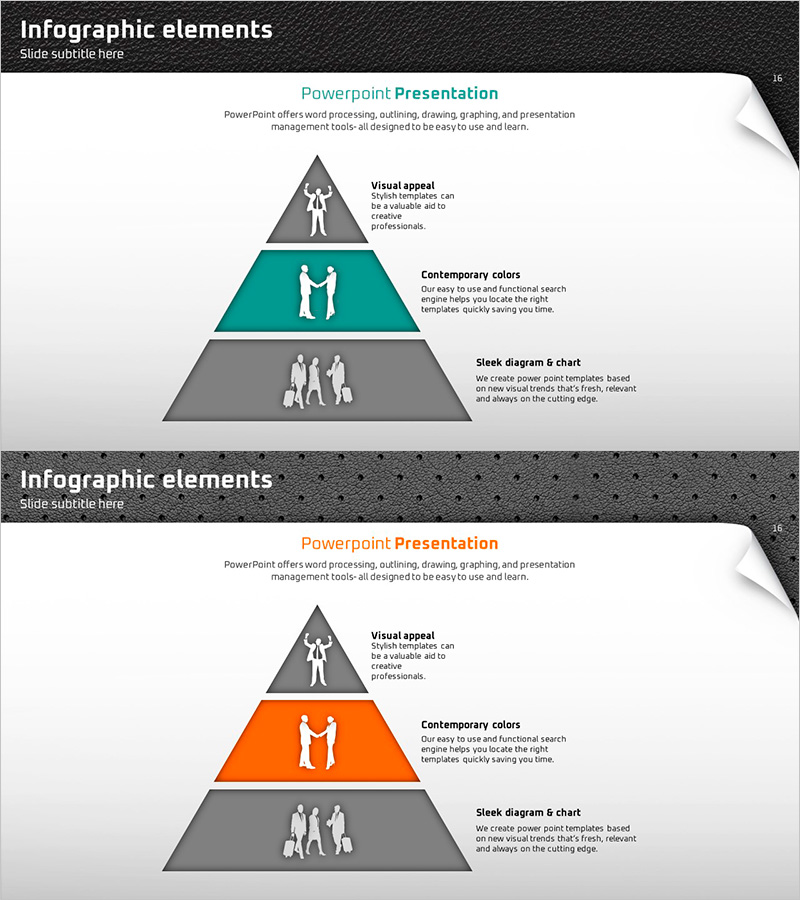
Quality PowerPoint Wide Template Pyramid – Business Strategy and Marketing Plan
#Business Introduction #Marketing Plan and Strategy #Diagram
-
Business Gradient Diagram – Visualizing Business Areas and Fields
#Company Introduction #Business Introduction #Diagram
-
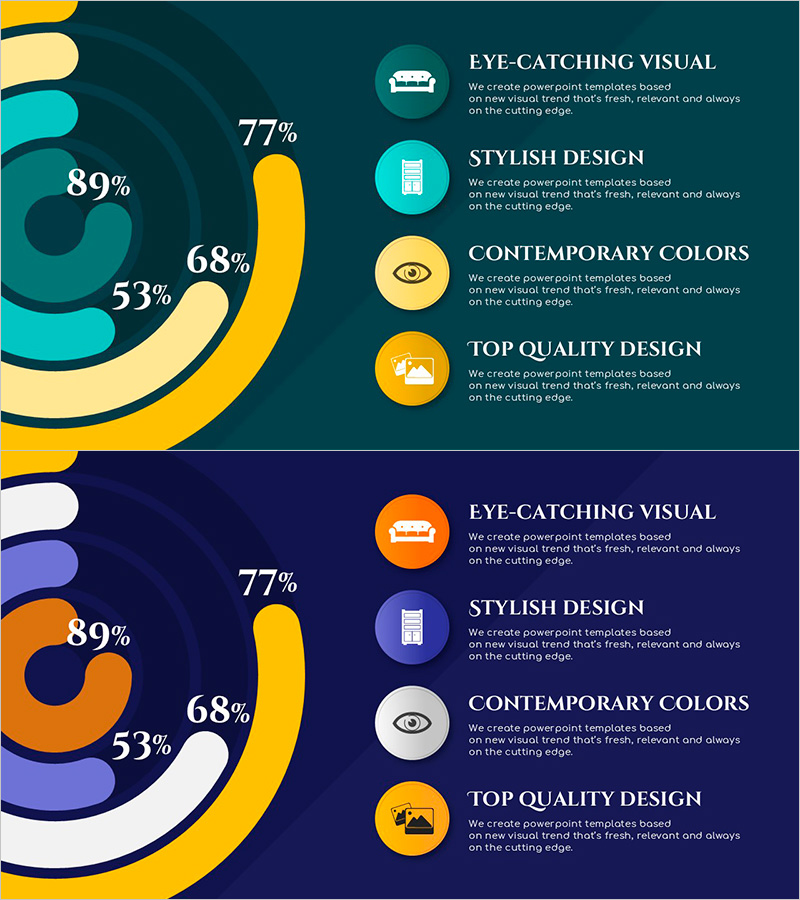
Current Accomplished Numerical Graph – Diagram Visualizing Achievements
#Business Promotion Strategy #Marketing Plan and Strategy #Diagram
-
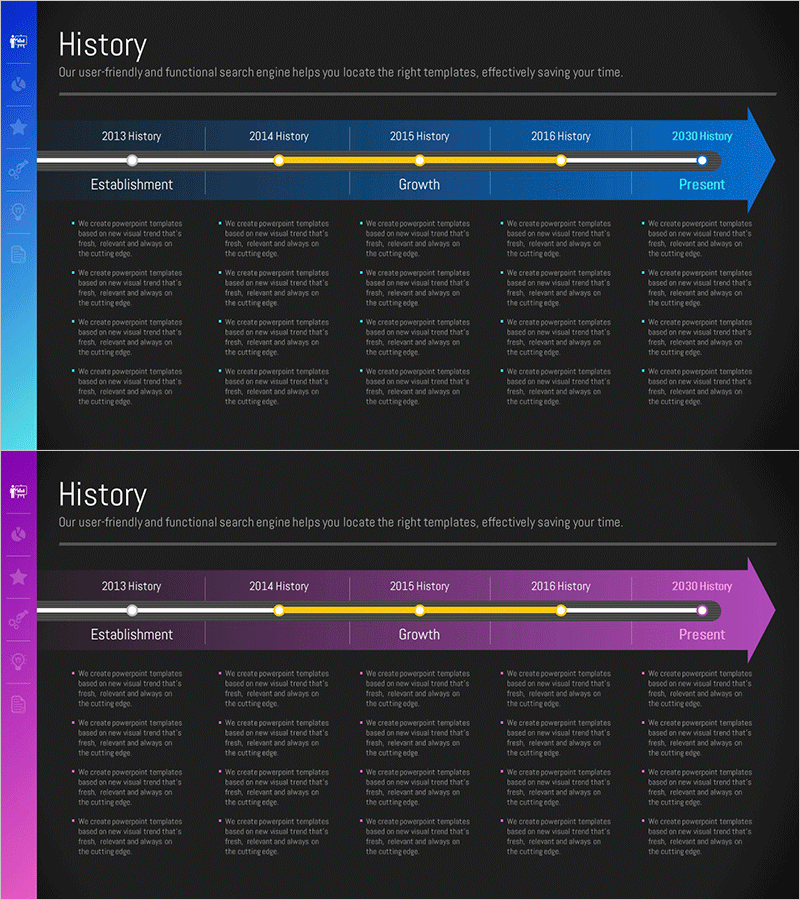
Arrow History Diagram – Business Strategy Presentation
#Company Introduction #Business Promotion Strategy #Diagram
