Company Introduction
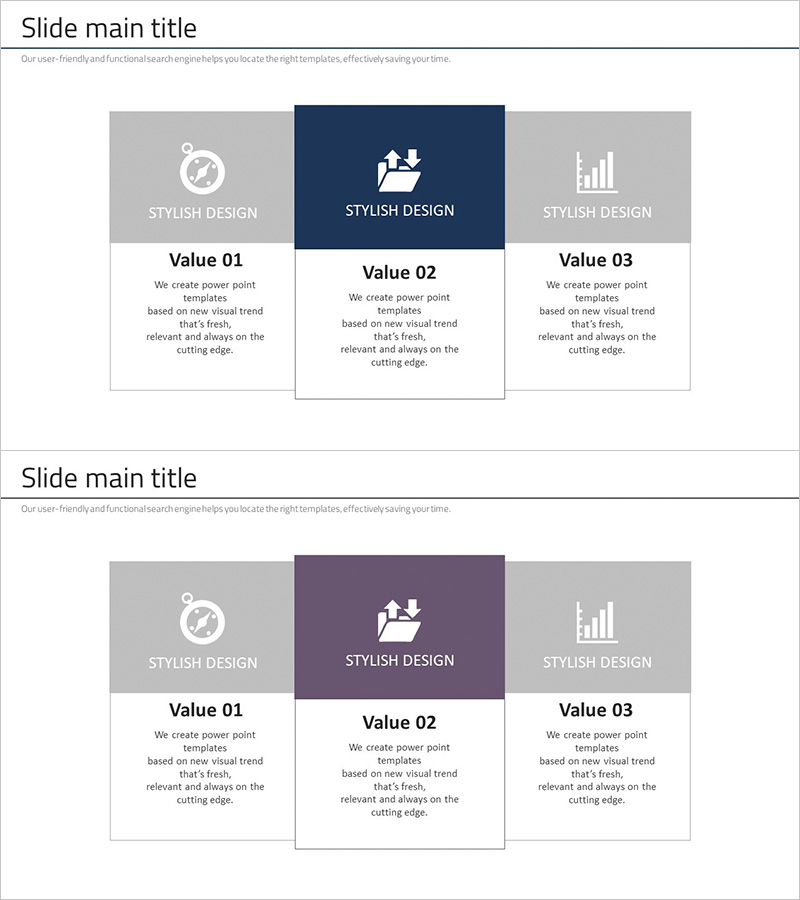
Business Area Data Analysis Diagram – Providing Business Insights
RJ0400060_7
- Last Update 12/21/2025
- File Size 0.6MB
- # of Slides 2
- File Format PPTX
- Slide Ratio 16:9
- Color
Keywords
About the Product
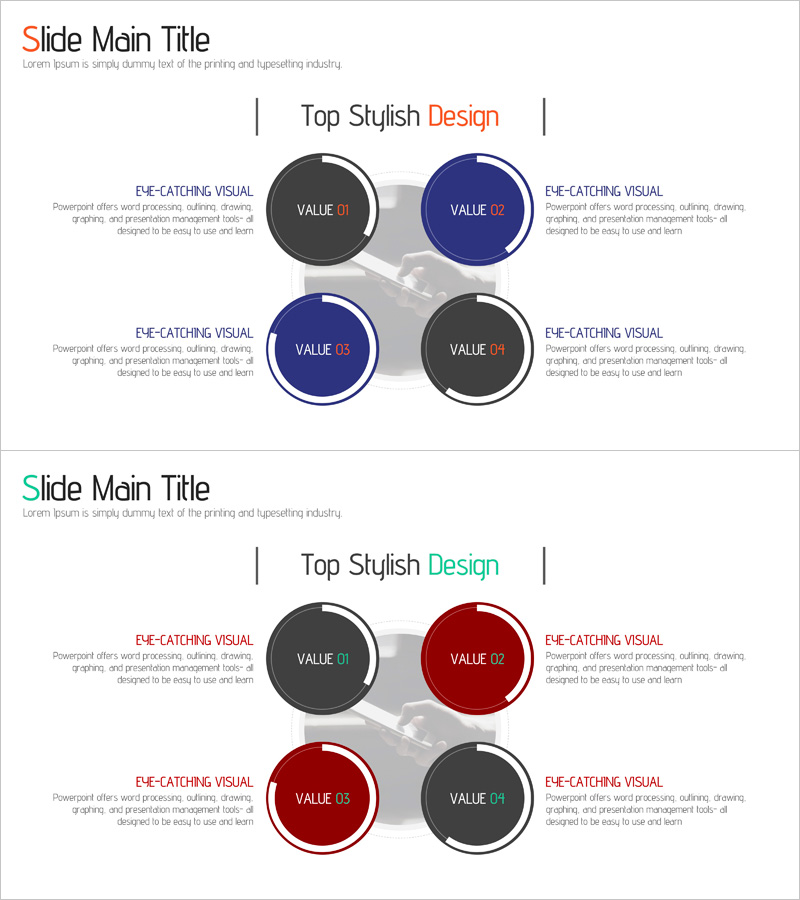
This diagram slide effectively analyzes and visualizes business areas. The integrated data visualization structure clearly communicates key indicators for each area, leaving a professional impression with a harmonious color scheme of navy and brown. It is particularly suitable for business presentations, client meetings, and report analyses, providing reliable business insights based on data. Text and data fields are easily replaceable, with an editing difficulty rated as 'easy', allowing for immediate integration into various presentations.
Related Products
-
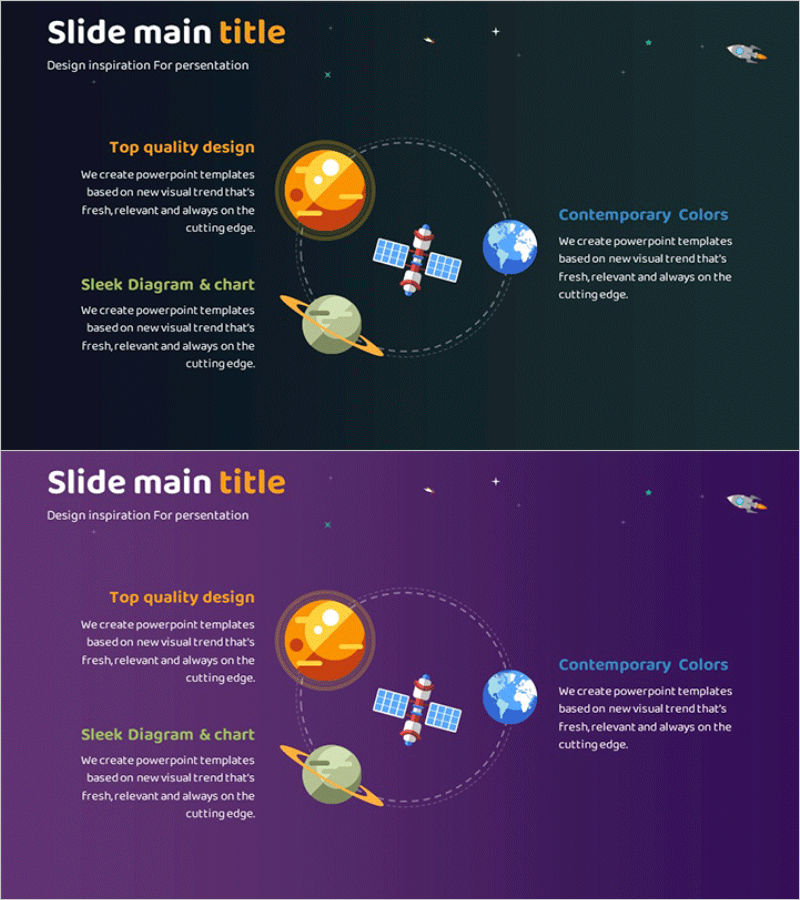
Space Industry Sector Diagram – Visualization of Business Sectors
#Product/Service #Business Introduction #Diagram
-
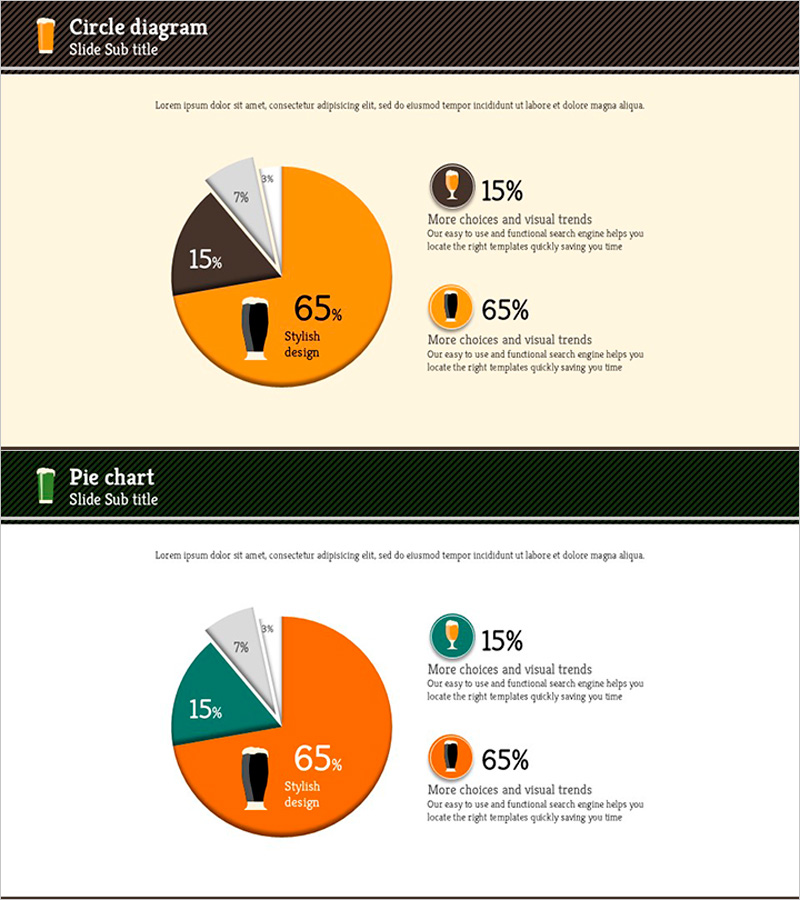
Pie Chart for Beer Market Share - Ideal for Market Analysis
#Company Introduction #Market and Competitor Analysis #Graph
-
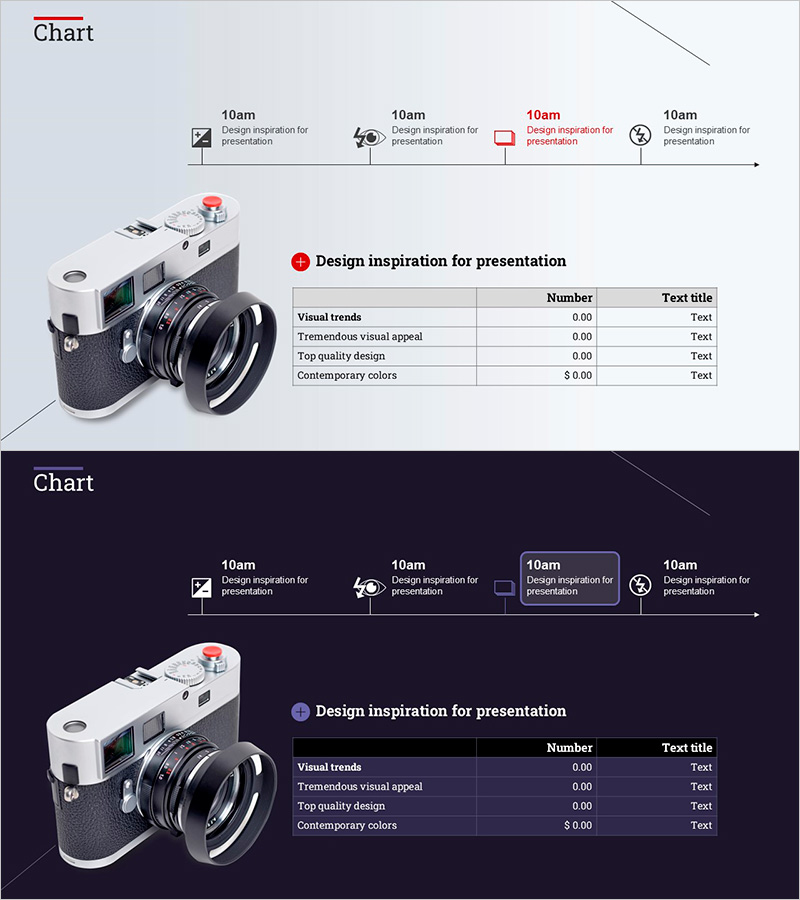
Camera System and Table Slide - Modern Design and Visual Appeal
#Product/Service #Diagram #Other
-
Data Analysis Program Overview – Visual Cluster
#Product/Service #Diagram #Program Introduction
