Company Introduction
Big Data Illustration History Diagram – Experience Innovation through Data Visualization
RJ0400053_5
- Last Update 12/21/2025
- File Size 0.2MB
- # of Slides 2
- File Format PPTX
- Slide Ratio 16:9
- Color
Keywords
About the Product
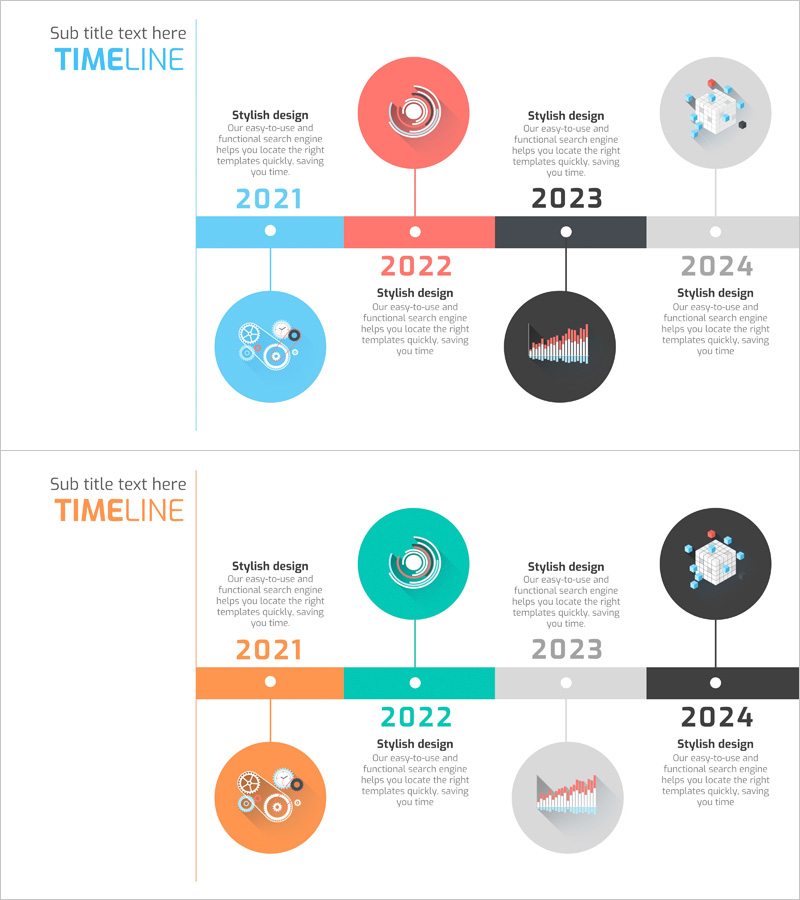
This slide features a history diagram utilizing big data, effectively visualizing complex information through cluster and connection structures. The harmonious arrangement of the timeline at the top and icons at the bottom conveys the company's major milestones effectively. The design emphasizes logs and patterns, making it suitable for data analysis, company introductions, and history presentations. The distinct color combination of blue and orange enhances visual interest, and the ease of text and graphic element replacement results in a moderate editing difficulty. It can be quickly integrated into various presentations.
Related Products
-
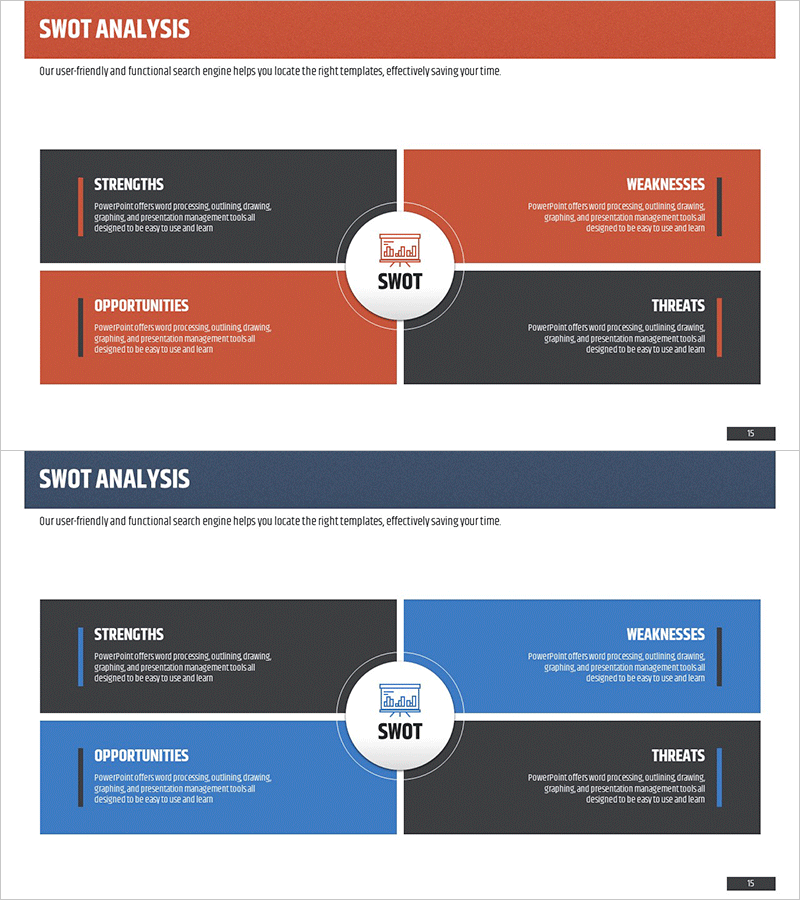
SWOT Analysis Diagram – Essential Tool for Market Analysis
#Market and Competitor Analysis #Diagram #SWOT Analysis
-

San Wide PowerPoint Company Overview
#Company Introduction #Company Overview
-

Business Year Achievement Goals – Business Strategy
#Business Promotion Strategy #Business Management #Diagram
-
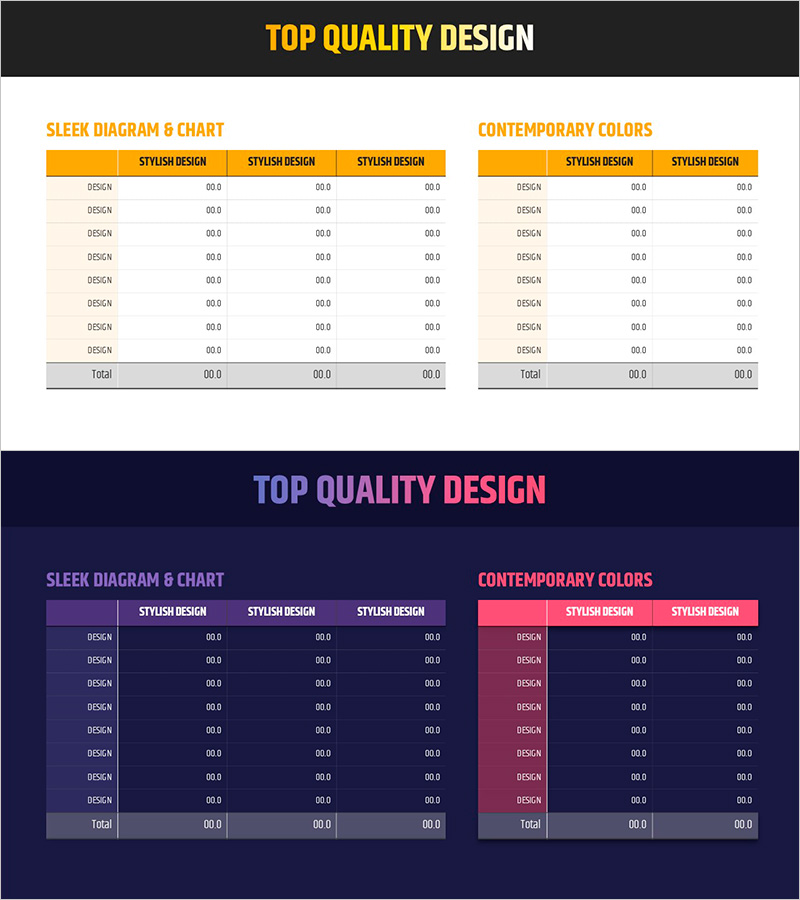
Simple Yellow Purple Table – Financial Performance Visualization
#Financial Plans and Performance #Diagram #Balance Sheet
