Market and Competitor Analysis
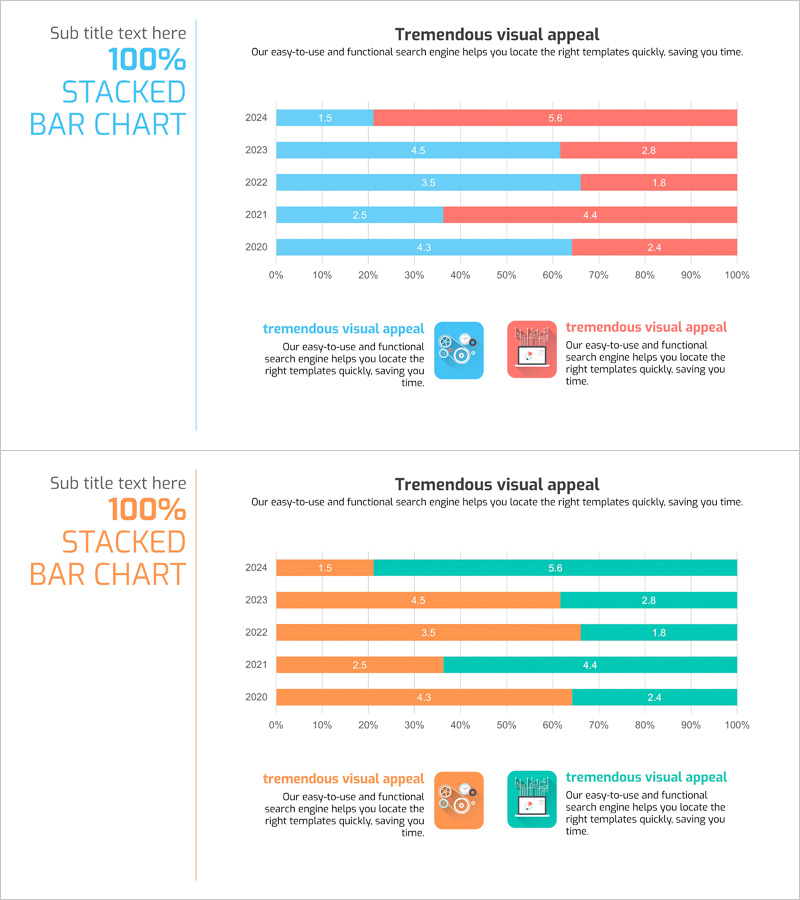
Big Data Field Analysis Graph – Horizontal Bar Chart Showing Competitive Advantage
RJ0400053_23
- Last Update 12/21/2025
- File Size 0.2MB
- # of Slides 2
- File Format PPTX
- Slide Ratio 16:9
- Color
Keywords
About the Product
This slide features a horizontal bar graph that effectively conveys analysis in the big data sector. The data is categorized into segmented items, allowing for intuitive visualization of percentage changes year by year. The color combination of blue and orange enhances clarity, making it suitable for business reports or proposals focused on competitor analysis. Target users include marketing professionals, data analysts, or executives, as it facilitates easy comparison and understanding of data. The slide is easy to edit, with text and data easily replaceable, resulting in a rating of 'easy' for editing difficulty.
Related Products
-
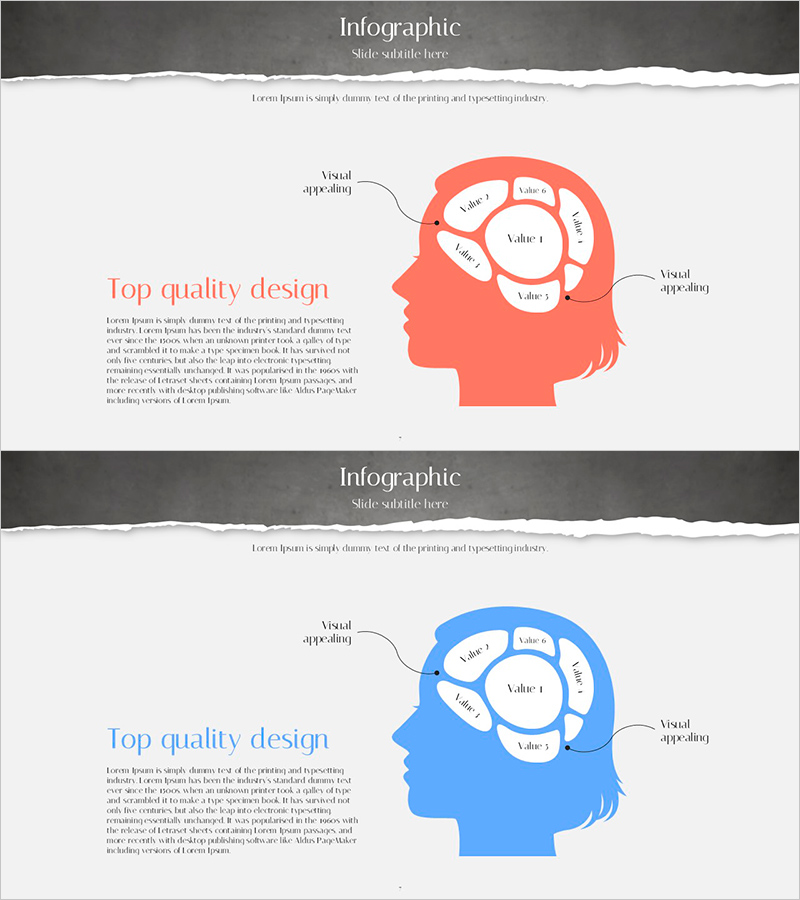
Infographic in a Woman's Head – Data Analytics and Customer Insight
#Product/Service #Market and Competitor Analysis #Diagram
-
Analysis of Other Brands’ Competitors – Market Strategy Planning
#Market and Competitor Analysis #Marketing Plan and Strategy #Diagram
-
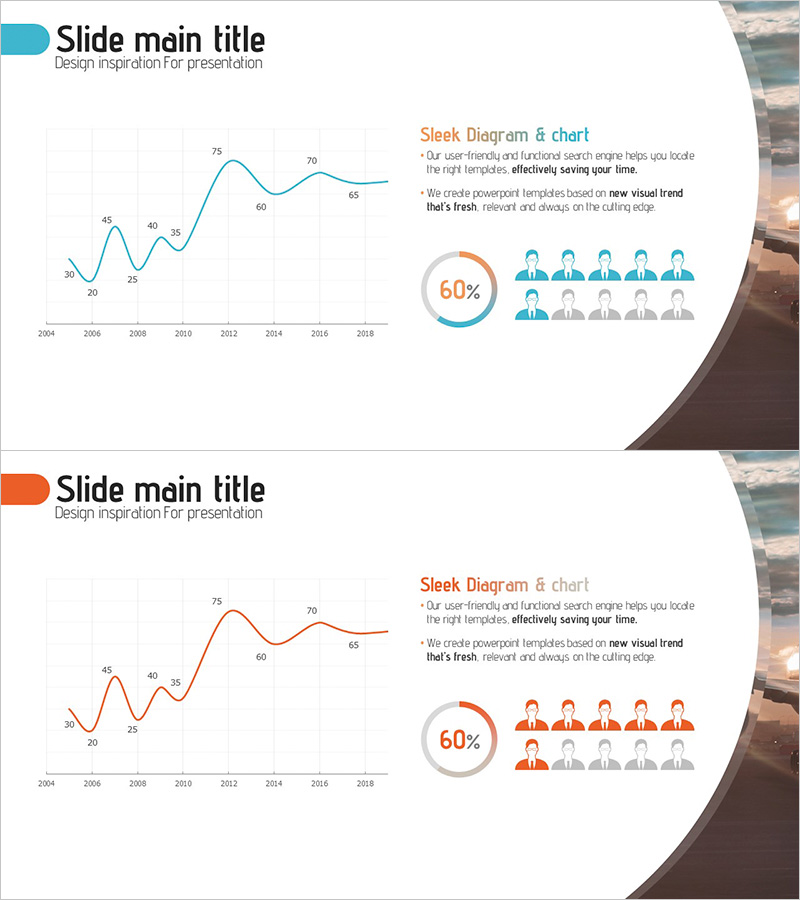
Customer Analysis Line Graph – Visualizing Market Insights
#Market and Competitor Analysis #Graph #Customer Analysis
-
Compare Three Curve Chart Trends
#Market and Competitor Analysis #Financial Plans and Performance #Graph
