Market and Competitor Analysis
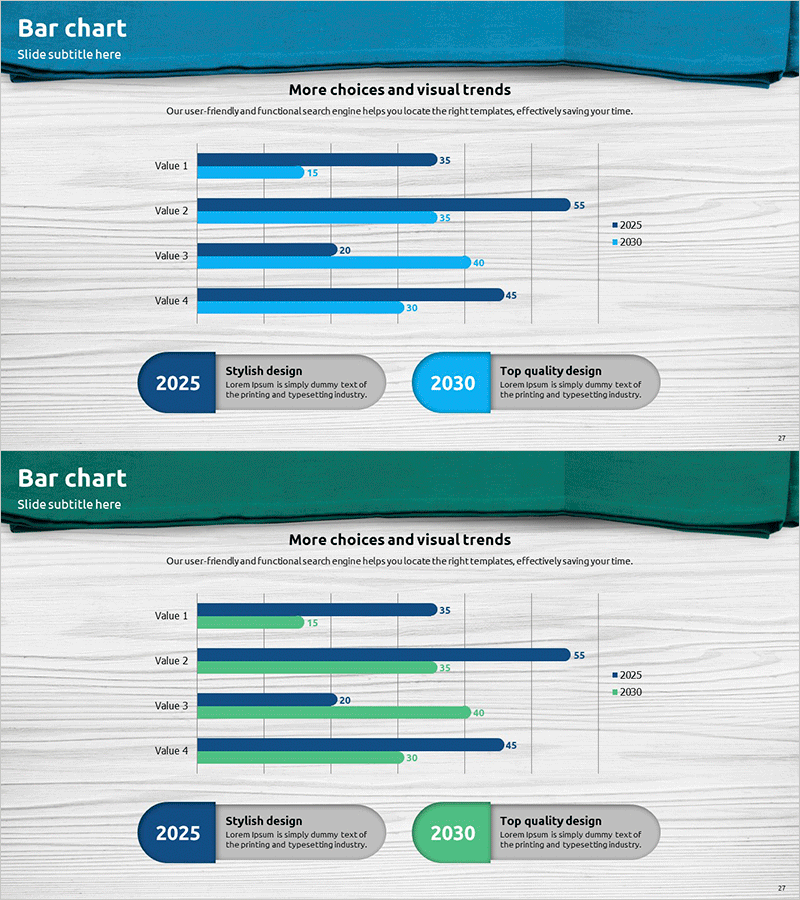
Year-over-year Comparison Analysis Bar Graph – Market Trends and Insights
RJ0400045_26
- Last Update 12/21/2025
- File Size 3MB
- # of Slides 2
- File Format PPTX
- Slide Ratio 16:9
- Color
Keywords
About the Product
This slide features a bar graph designed for year-over-year performance comparison. Optimized for market analysis, this template visually presents data for 2025 and 2030, allowing for quick insights into annual trends. It serves as a critical visual aid for competitor analysis and strategic meetings. With a combination of professional blue and green colors, it provides a sense of stability and trust. The editing difficulty is rated as 'medium', making it easy to replace text and data for immediate use in various business scenarios.
Related Products
-

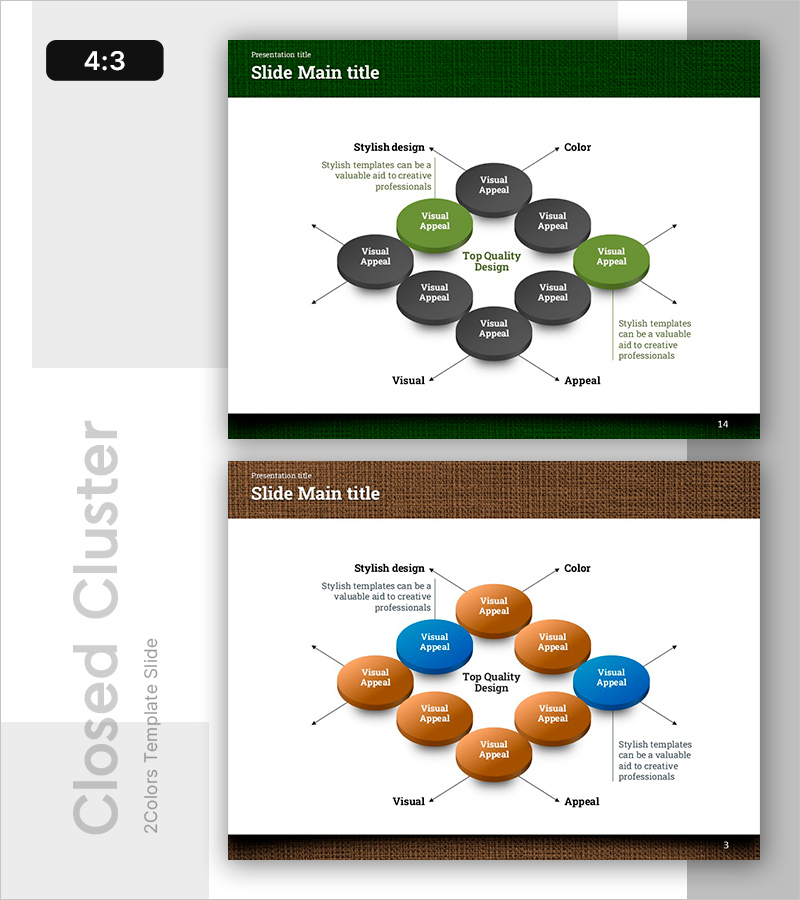
Triangular Pattern Bar Chart Template – Market Insight Analysis
#Business Promotion Strategy #Market and Competitor Analysis #Graph
-
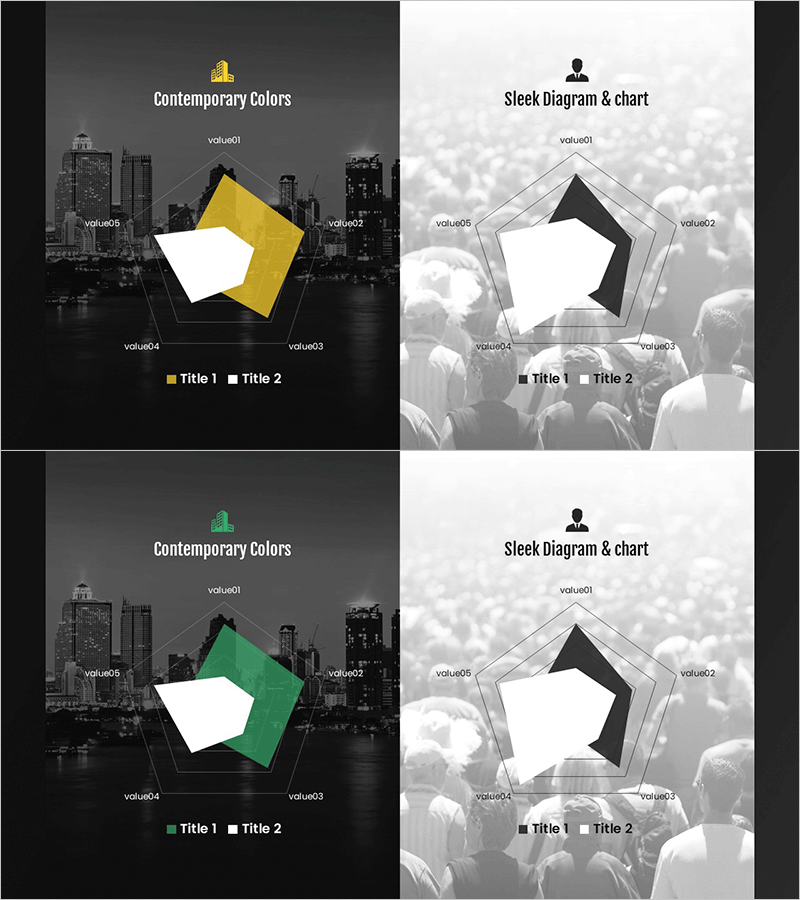
City Theme Radial Graph Slide – Market and Competitor Analysis
#Business Introduction #Market and Competitor Analysis #Graph
-
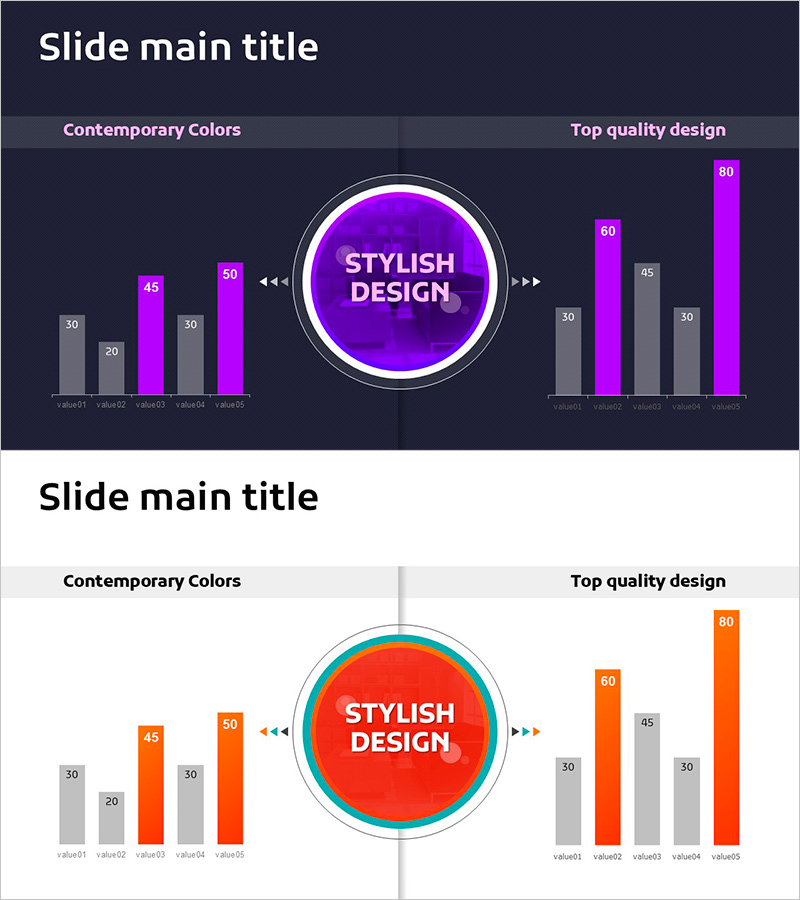
Target Sales Vertical Bar Graph - Visualizing Business Performance
#Business Vision and Strategy #Business Promotion Strategy #Diagram
-
Wellness Value Positioning Slide – Market Analysis and Marketing Strategy
#Market and Competitor Analysis #Marketing Plan and Strategy #Diagram
