Product/Service
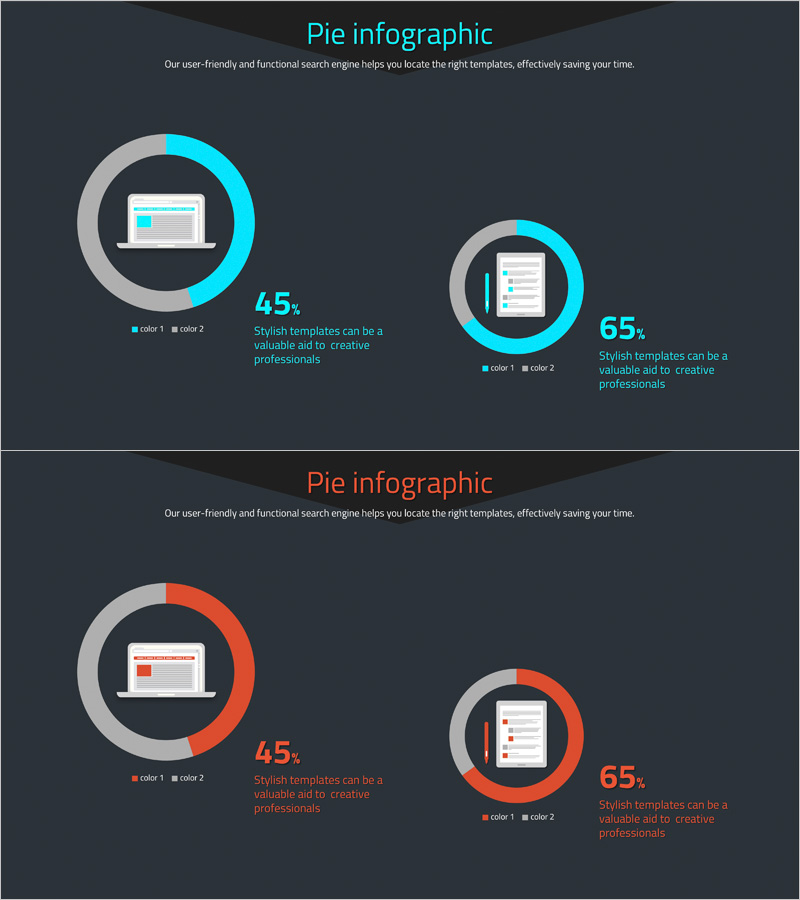
Website Technology Development Status Graph – Market Share and Trends
RJ0400041_6
- Last Update 12/21/2025
- File Size 0.2MB
- # of Slides 2
- File Format PPTX
- Slide Ratio 16:9
- Color
Keywords
About the Product
This slide features a donut chart that visually represents the development status of website technologies. It is ideal for analyzing market trends, competitive analysis, and product/service introductions, allowing for easy comprehension of the proportion of developing technologies. The design elements harmonize well, highlighting key data and innovation trends effectively. The main colors are blue and orange, maximizing visual impact. Users can easily replace text and graph values to match their message, with an editing difficulty rated as moderate, making it suitable for various presentations.
Related Products
-
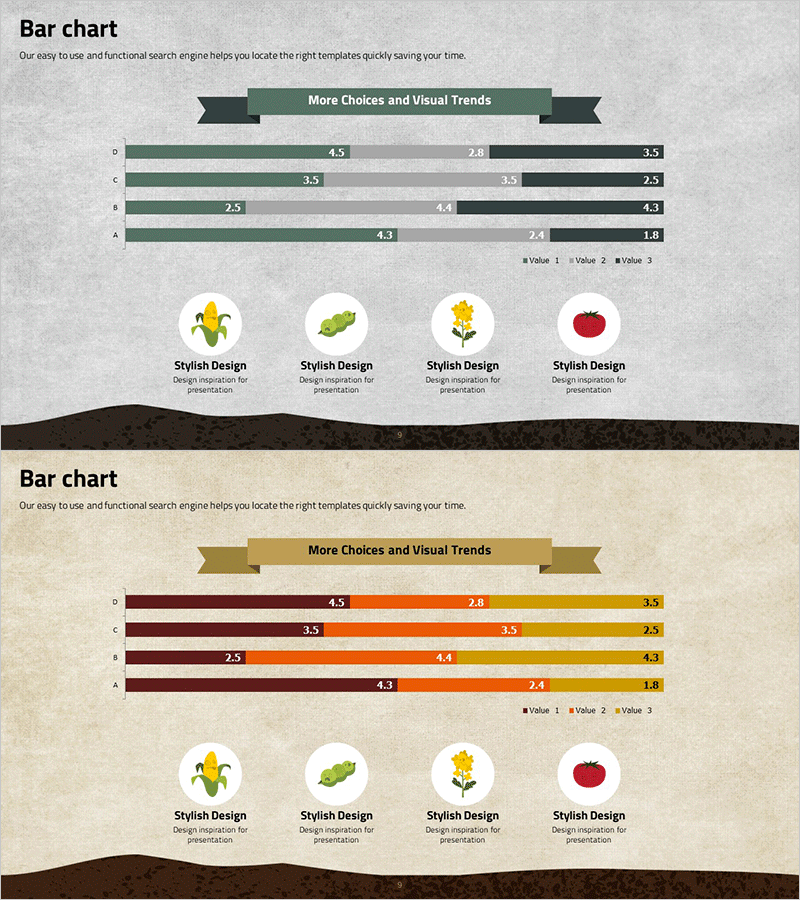
Crop Analysis Detailed Bar Graph – Insights into Market and Competition
#Market and Competitor Analysis #Diagram #Graph
-
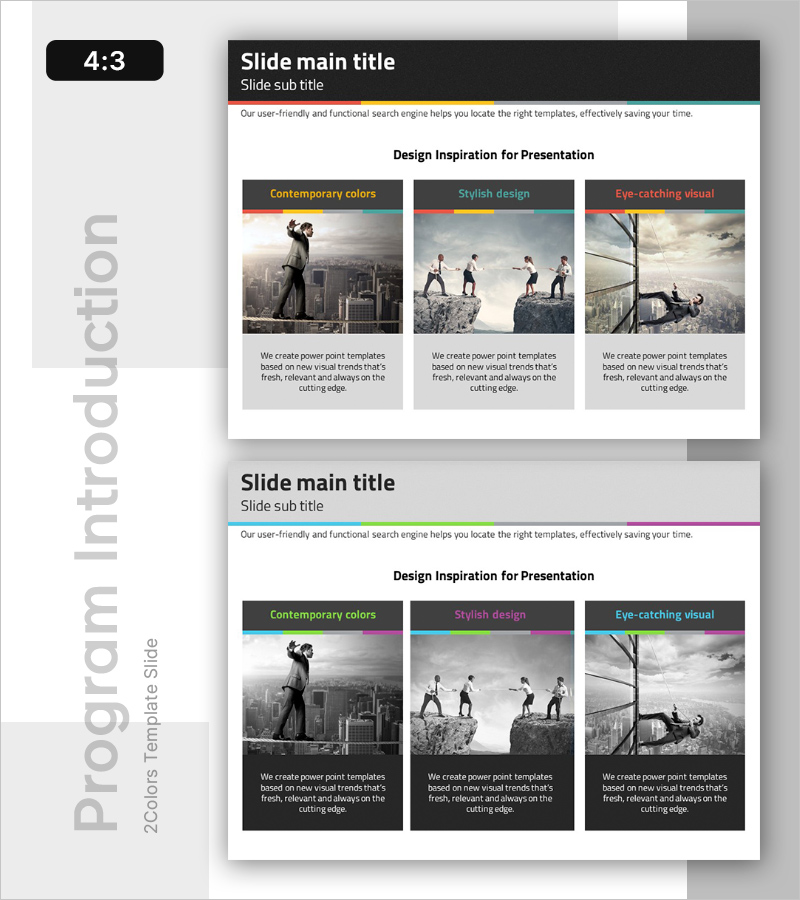
Action-Oriented Program Overview – Innovative Approach
#Product/Service #Business Vision and Strategy #Diagram
-
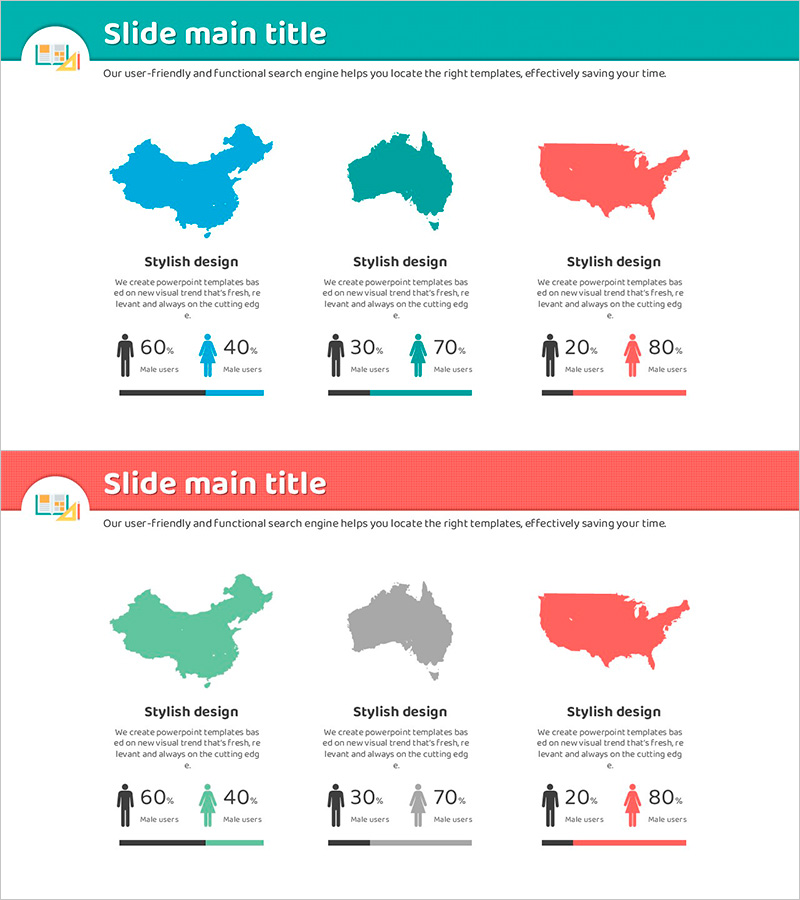
Male and Female Analysis by Country – Insights on Gender Ratio and Market Trends
#Market and Competitor Analysis #Marketing Plan and Strategy #Diagram
-

Business Management Goals Slide – Clear Goal Setting
#Company Introduction #Product/Service #Diagram
