Company Introduction
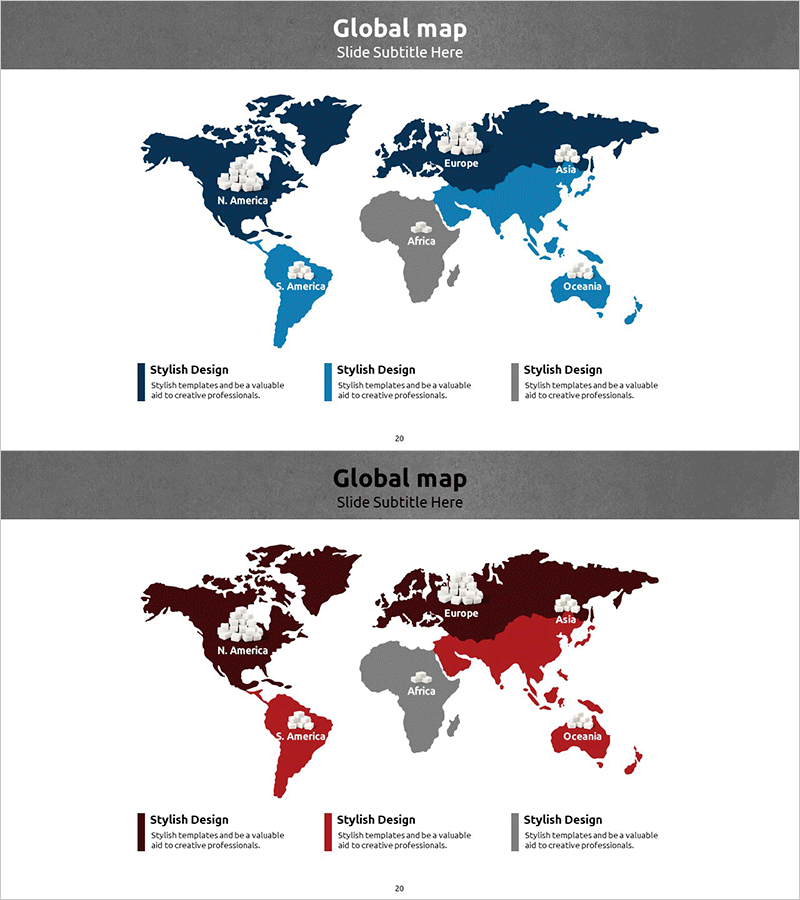
Map of Sugar Use by Country
RJ0400034_19
- Last Update 12/21/2025
- File Size 2.4MB
- # of Slides 2
- File Format PPTX
- Slide Ratio 16:9
- Color
Keywords
About the Product
This slide presents a visually engaging map analyzing sugar consumption across countries. It is designed for easy understanding of sugar usage patterns, making it useful for global market entry strategies and competitive analysis. The blue, red, and gray color scheme effectively distinguishes data regarding each nation. This map slide is ideal for market research reports or global business presentations, offering intuitive information. Text and mapping data are easy to replace with an overall editing difficulty rated as 'easy'.
Related Products
-
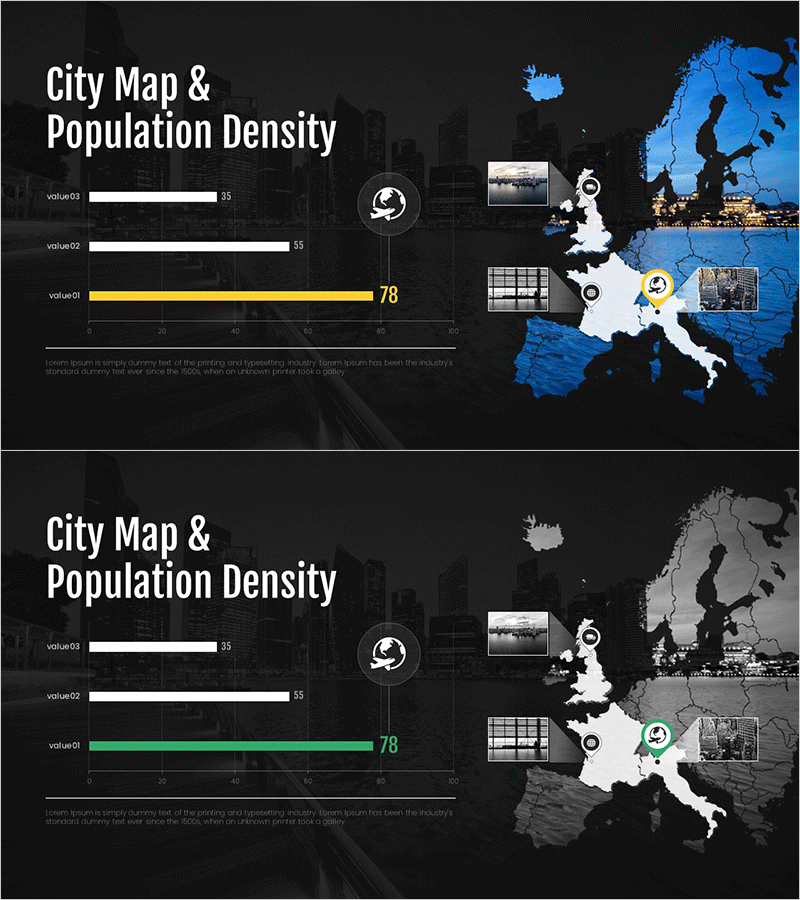
City Map & Population Density Insights Slide – Market and Competitive Analysis
#Market and Competitor Analysis #Graph #Other
-
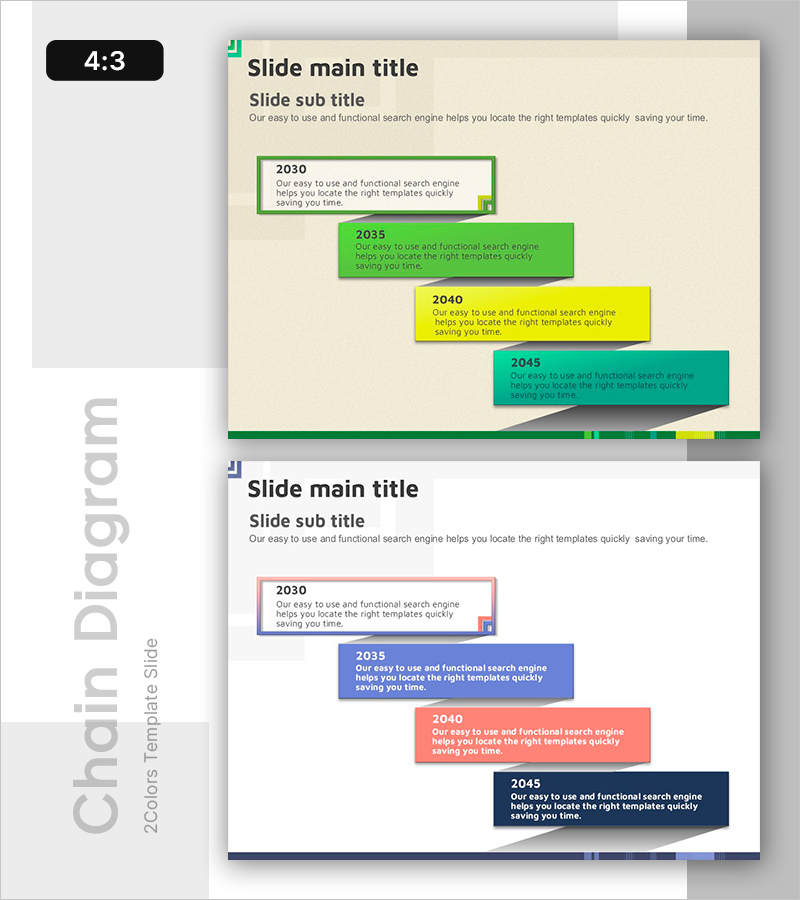
Milestones in Motion: A Connected Diagram – Flowing Timeline
#Company Introduction #Diagram #History
-
Business Management Goals Slide – Clear Goal Setting
#Company Introduction #Product/Service #Diagram
-
Security Business Area Diagram – Cluster Visualization for Business Presentation
#Company Introduction #Business Introduction #Diagram
