Technology Sector
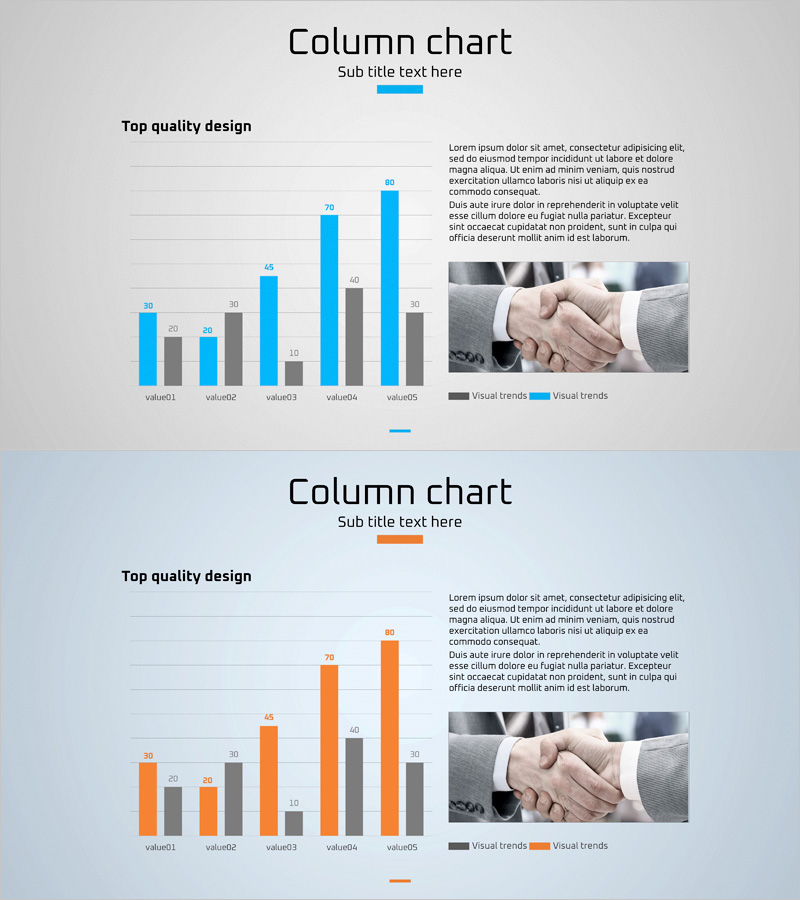
Column Chart for Product Service Sales Outlook – Harmony of Blue and Orange
RJ0400021_25
- Last Update 12/21/2025
- File Size 1.9MB
- # of Slides 2
- File Format PPTX
- Slide Ratio 16:9
- Color
Keywords
About the Product
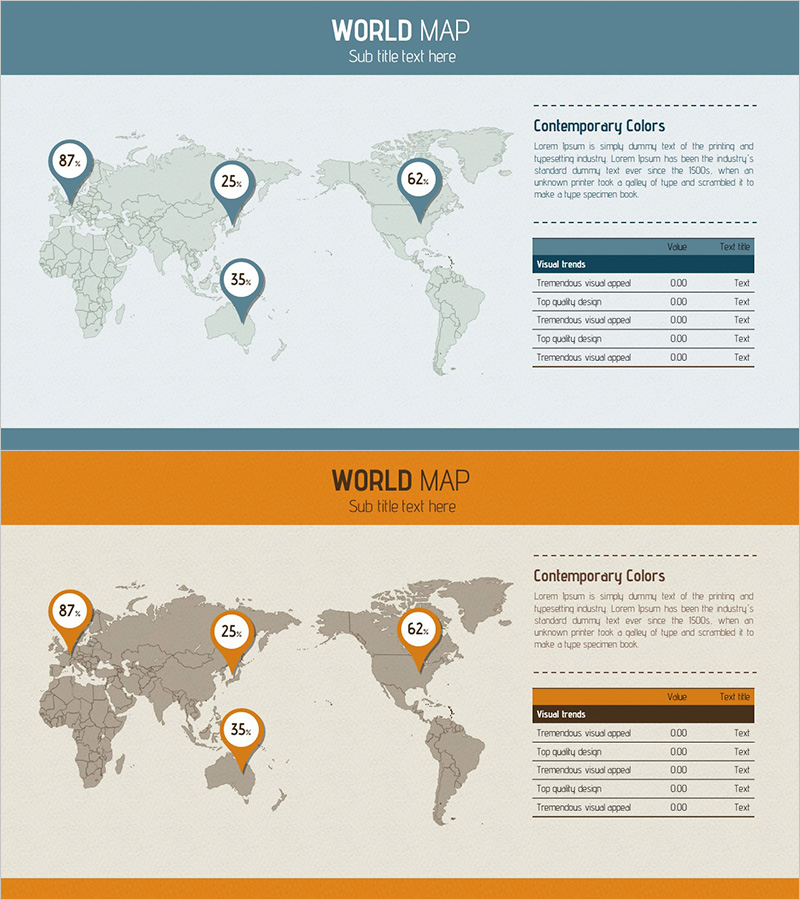
This slide utilizes a column chart to visually emphasize the sales outlook and development direction of product services. The harmonious combination of blue and orange clearly communicates data comparisons, making it useful for market and competitor analysis. Infused with the sentiment of 'business growth', it leaves a strong impression when presented to investors or executives. Text and data fields are easily replaceable, with an editing difficulty rated as 'easy', allowing for quick adaptation in various presentation materials.
Related Products
-
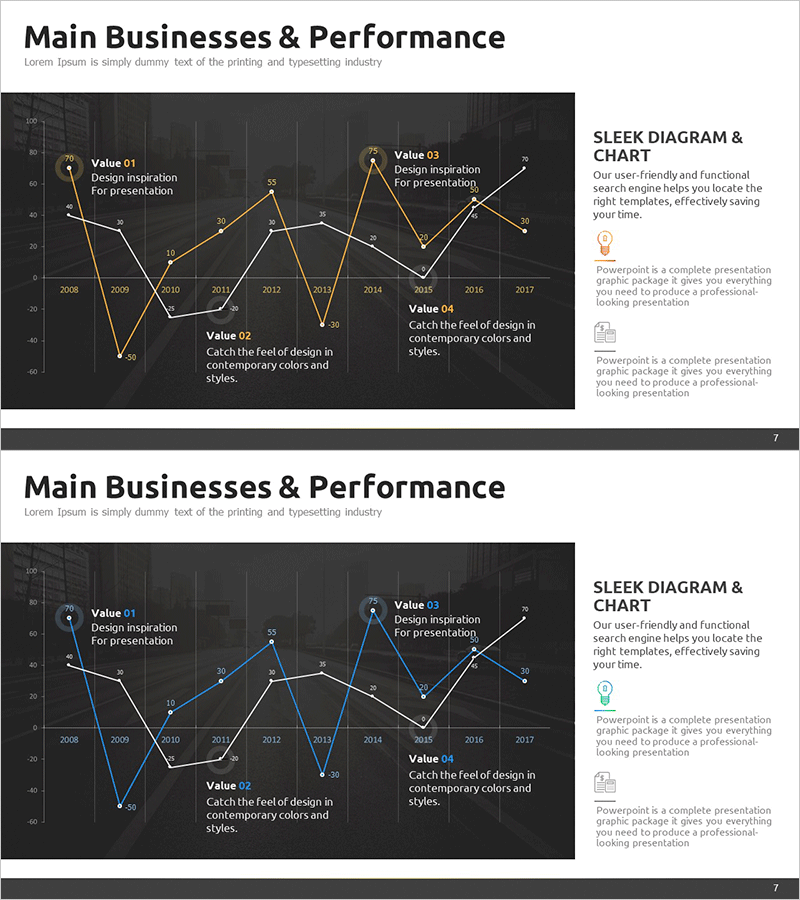
Main Business and Performance Analysis Graph – Insights Based on Data
#Company Introduction #Business Introduction #Graph
-
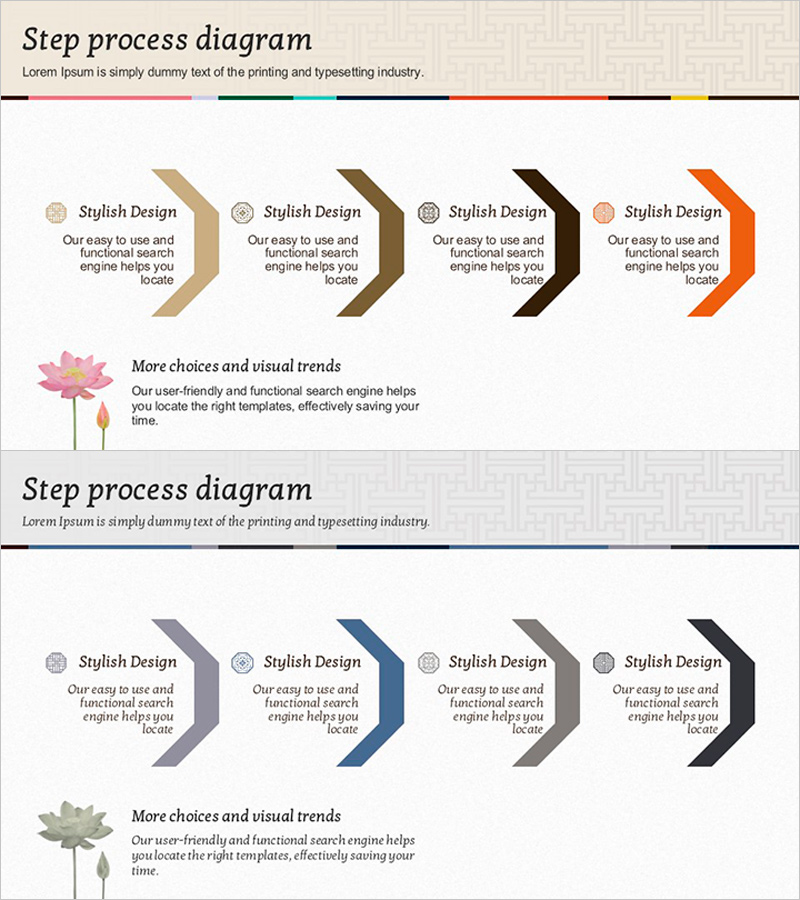
Flow Process Slide Visualized with Traditional Patterns
#Business Promotion Strategy #Technology Sector #Diagram
-
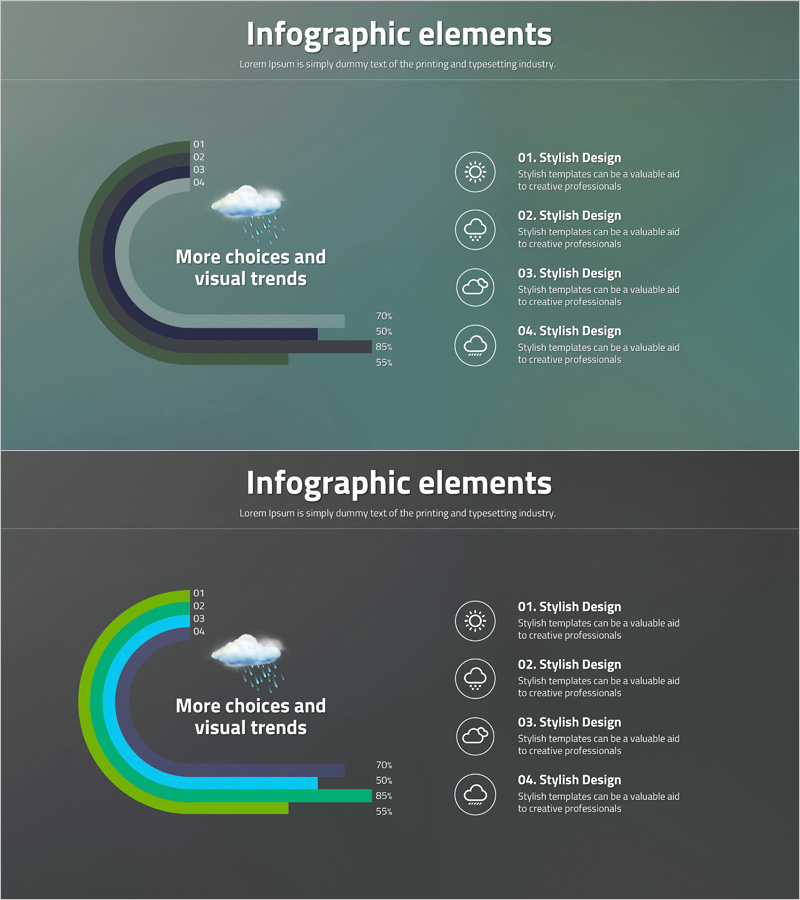
Infographic Slide for Effective Communication – Creative Visualization
#Company Introduction #Market and Competitor Analysis #Company Overview
-
Global Market Analysis – Global Network and Target Market
#Company Introduction #Market and Competitor Analysis #Diagram
