Company Introduction
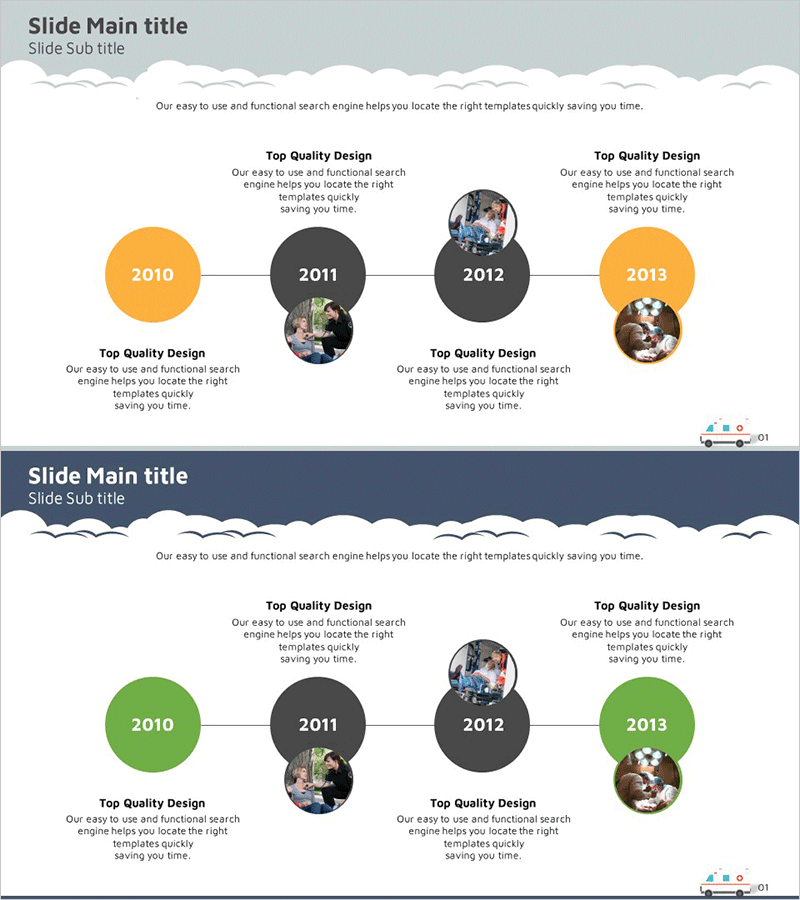
Cluster Connection History Diagram – Visualizing Company Growth
RJ0400011_4
- Last Update 12/21/2025
- File Size 0.4MB
- # of Slides 2
- File Format PPTX
- Slide Ratio 16:9
- Color
Keywords
About the Product
This slide features a cluster connection history diagram designed to visually highlight company growth. It is characterized by a clean layout in white and navy colors, with key events arranged neatly by year for clear information delivery. This slide is ideal for explaining a company's history or development process in business reports, presentations, or proposals. With high readability and an intuitive design, it enhances effective communication. Text and images are easily replaceable, and the editing difficulty is rated as medium.
Related Products
-

Business Objectives Introduced by the Representative – Vision Towards Achievement
#Company Introduction #Business Vision and Strategy #Diagram
-
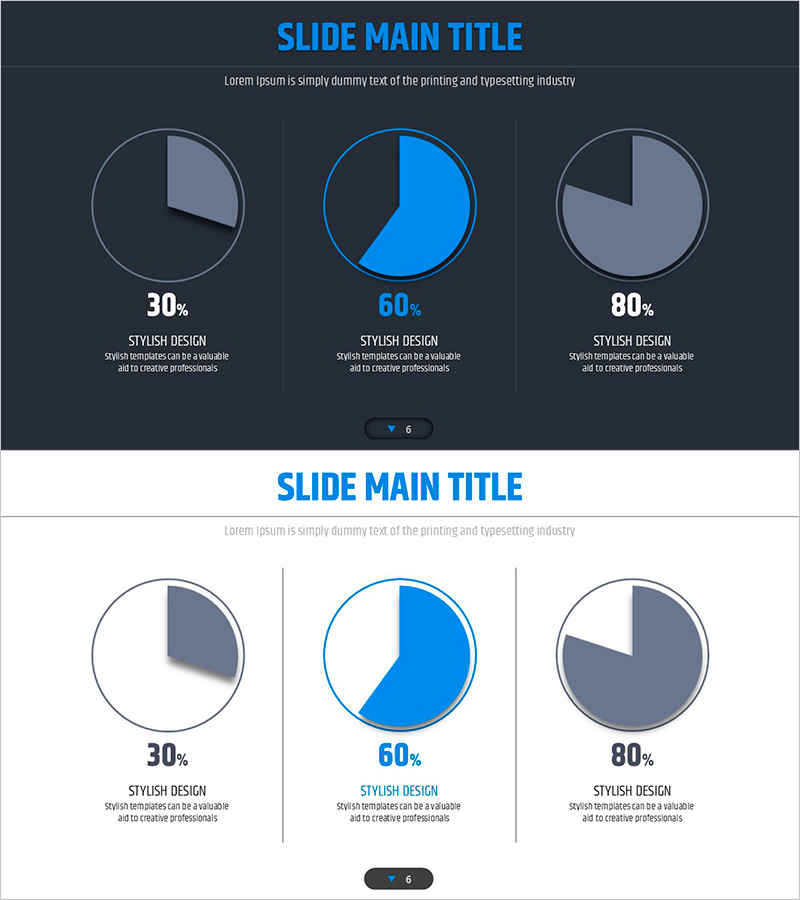
Four Color Infographic Template for Data Visualization Using Pie Charts
#Company Introduction #Product/Service #Graph
-

Company Core Vision Introduction – Effective Delivery of Vision and Goals
#Company Introduction #Product/Service #Core Values, Vision, and Mission
-

Step-by-Step Gear System Presentation Template – Innovation and Efficiency
#Technology Sector #Diagram #Service Development Approach
