Product/Service
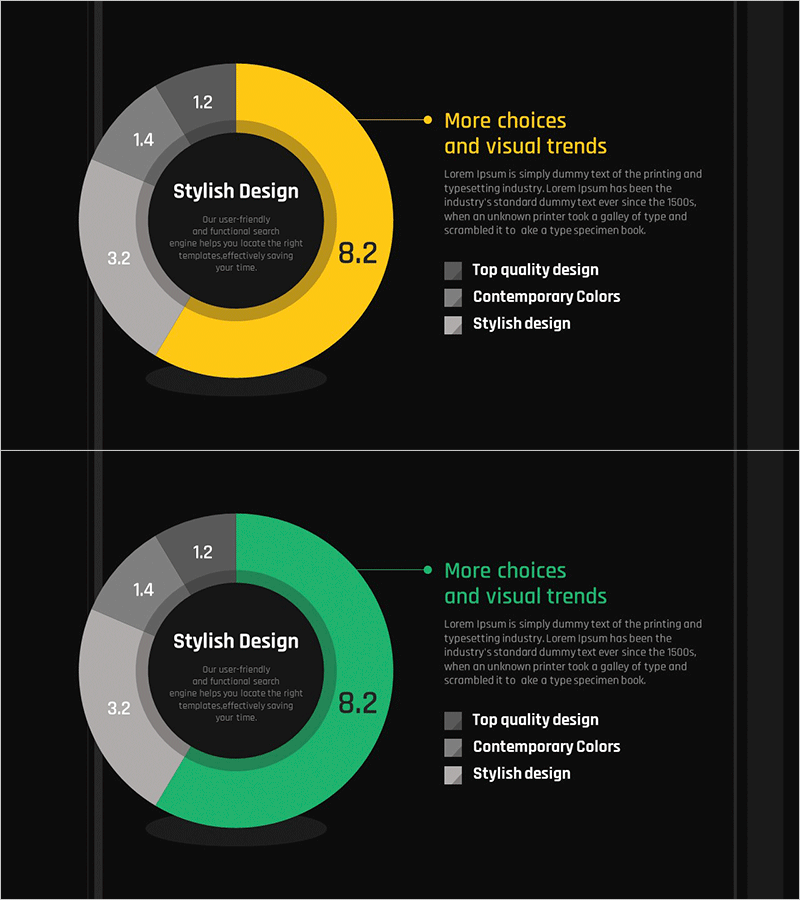
Development Status Analysis Donut Chart – Market Share Visualization
RJ0300092_5
- Last Update 12/21/2025
- File Size 1.1MB
- # of Slides 2
- File Format PPTX
- Slide Ratio 16:9
- Color
Keywords
About the Product
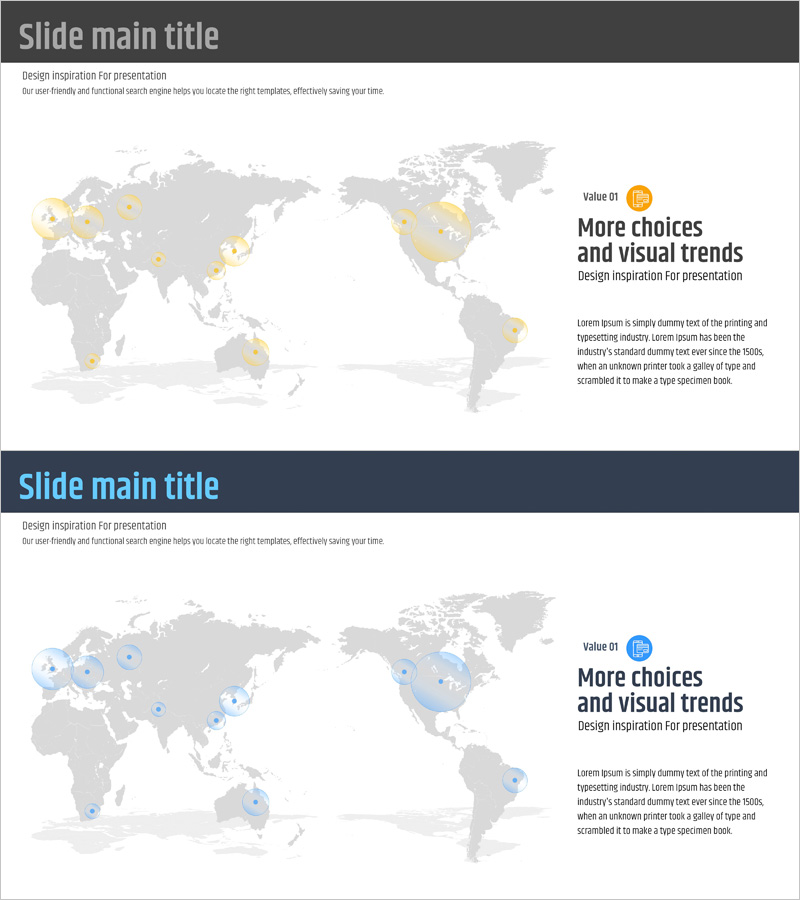
This slide features a donut chart designed to visually represent the development status. The primary colors of yellow and green emphasize visual contrast, clearly conveying data to the viewer. This slide is ideal for presentations analyzing market share and comparing competitors. It encapsulates the emotion of 'market trend analysis,' making it effective for discussions and presentations about business direction. Text and chart fields can be easily replaced, with an overall editing difficulty rated as 'easy', allowing for quick integration into presentations.
Related Products
-
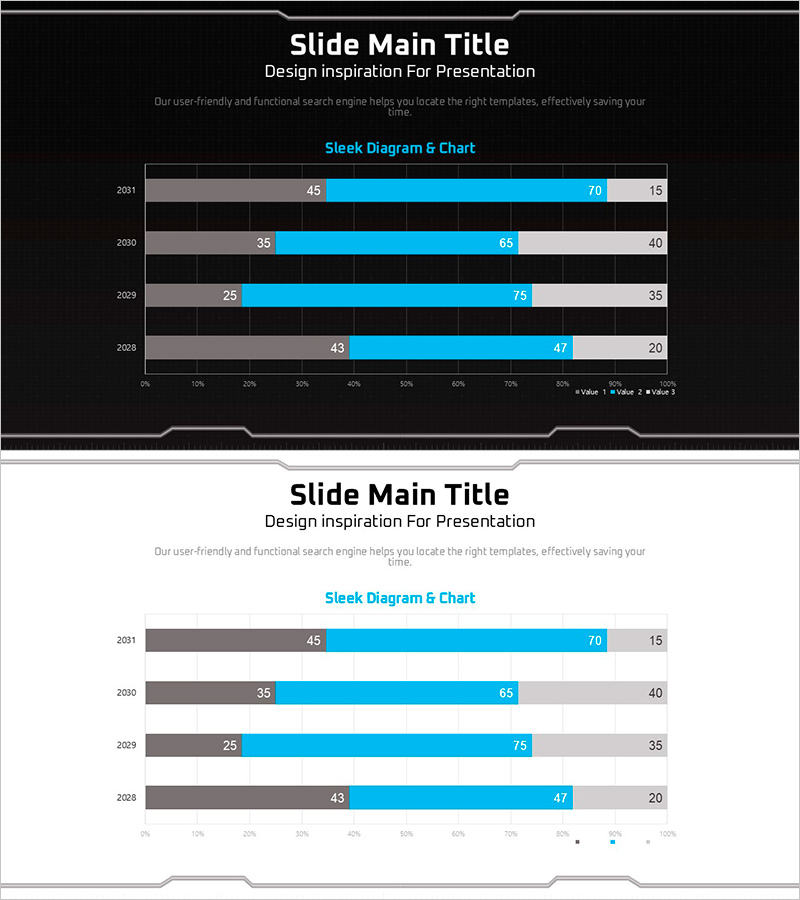
Geometry PPT Template Wide Horizontal Bar Segmentation Graph
#Market and Competitor Analysis #Graph #Industry Trends
-
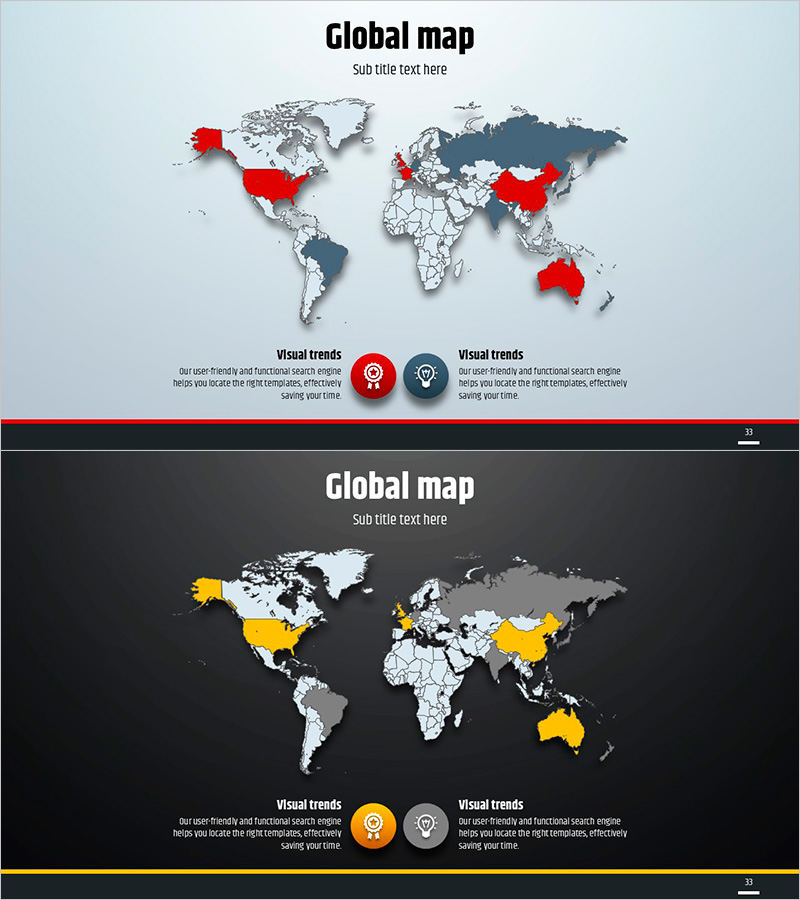
Simple Circle Presentation Template Global Map – Global Market Analysis
#Company Introduction #Market and Competitor Analysis #Other
-
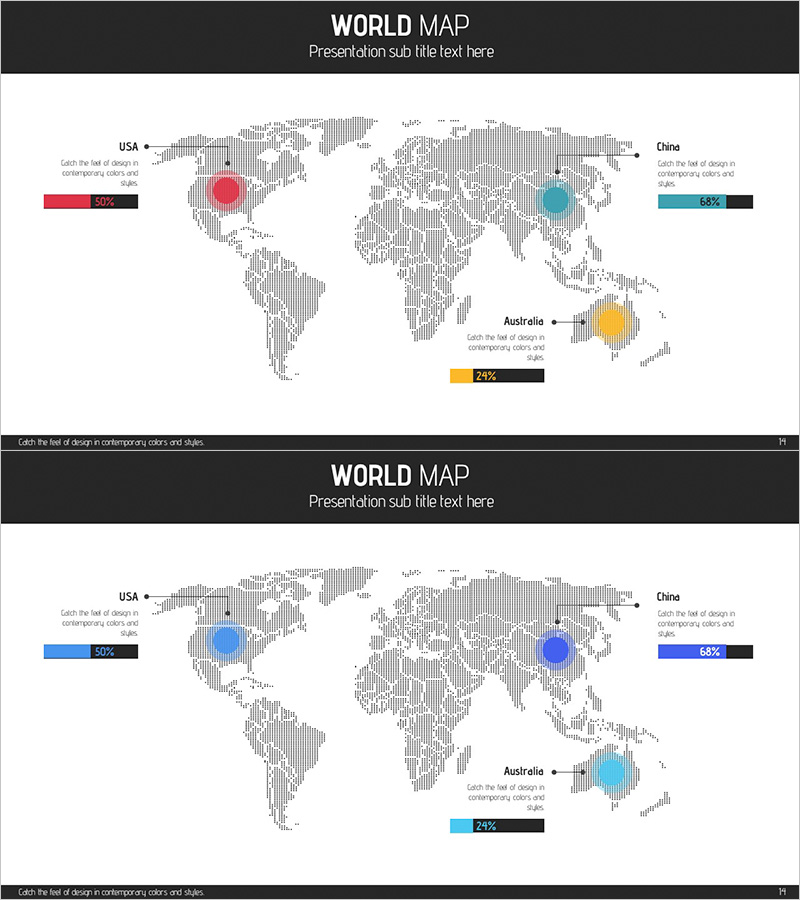
Dot Map Analysis Graph – Global Network and Target Market
#Company Introduction #Market and Competitor Analysis #Graph
-
Global Target Market Analysis Slide – Strategic Insights
#Company Introduction #Market and Competitor Analysis #Other
