Product/Service
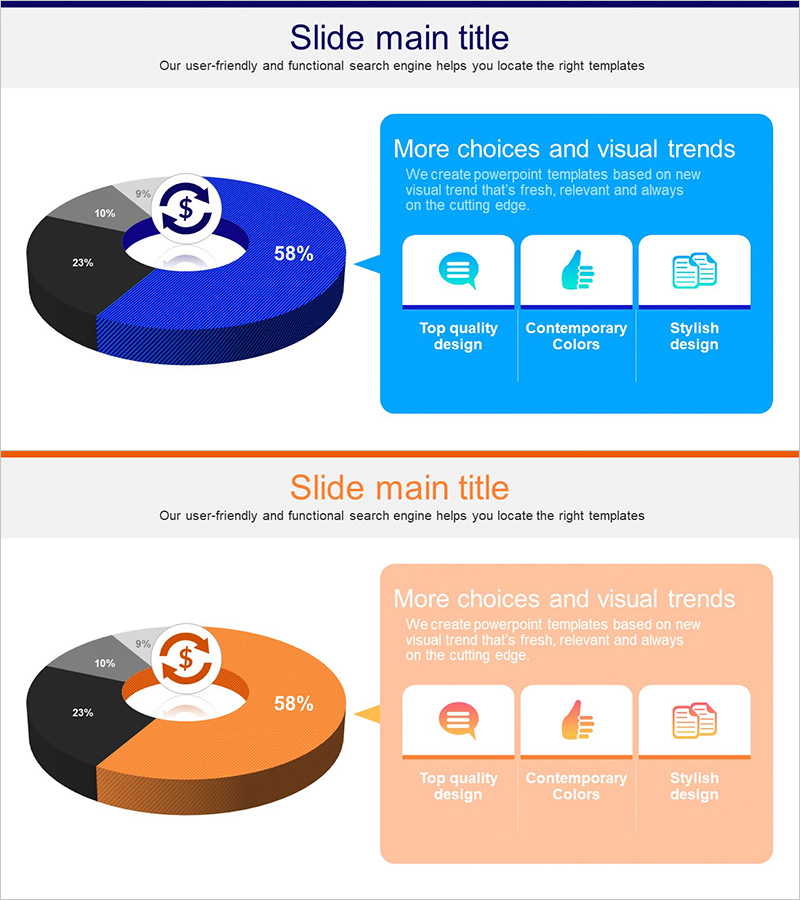
Blue Orange 3D Donut Graph - Visual Data Analysis
RJ0300082_6
- Last Update 12/21/2025
- File Size 0.1MB
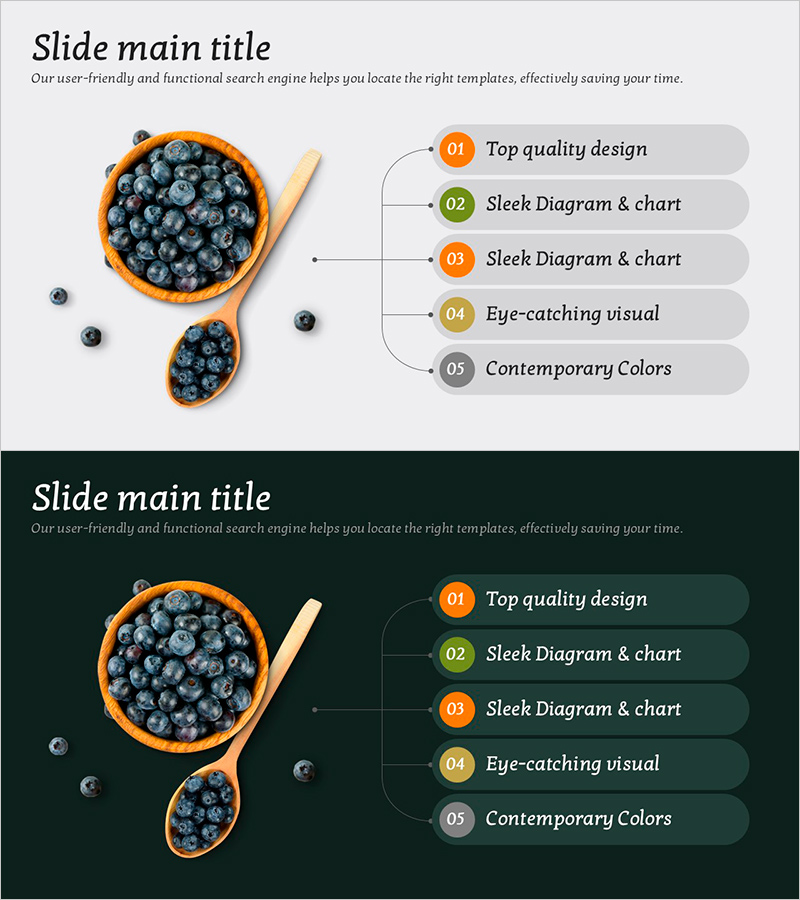
- # of Slides 2
- File Format PPTX
- Slide Ratio 16:9
- Color
Keywords
About the Product
This slide features a powerful 3D donut graph in blue and orange colors, designed to visually analyze business data. Each segment is clearly defined, enhancing the clarity of various data sets. Ideal for 'Product/Service Introductions', this graph serves efficiently to present market statuses or analytical results. The unique design captivates the audience's attention, thus enhancing the impact of the presentation.
Related Products
-
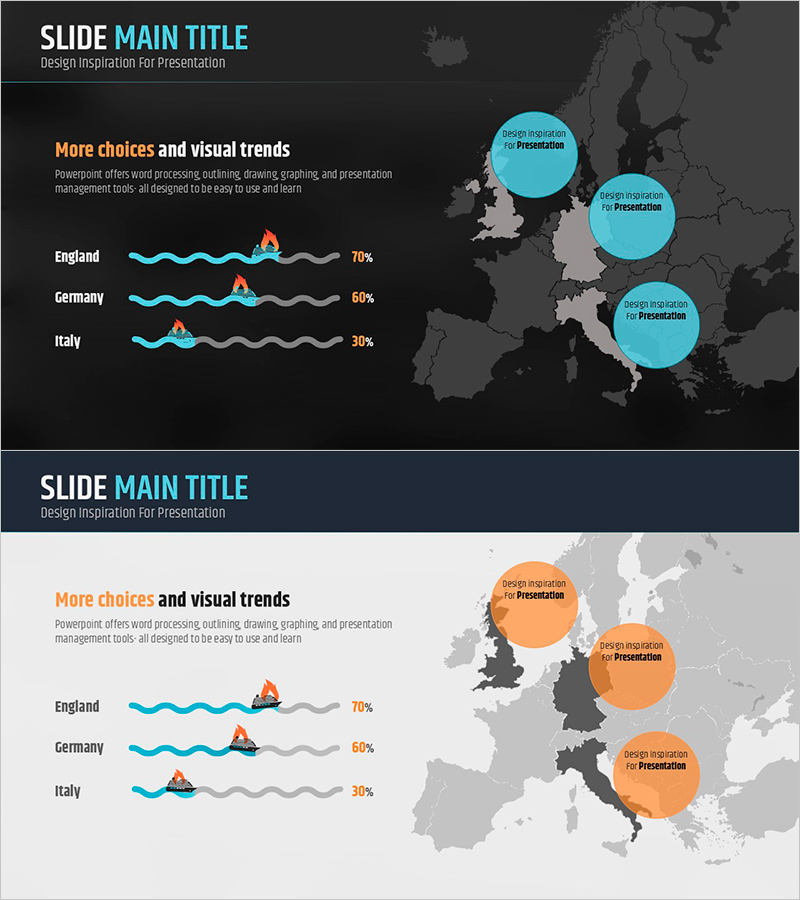
Analysis of Ship Fire Accident – Capturing Stability and Trust
#Market and Competitor Analysis #Risk Management and Regulatory Compliance #Graph
-
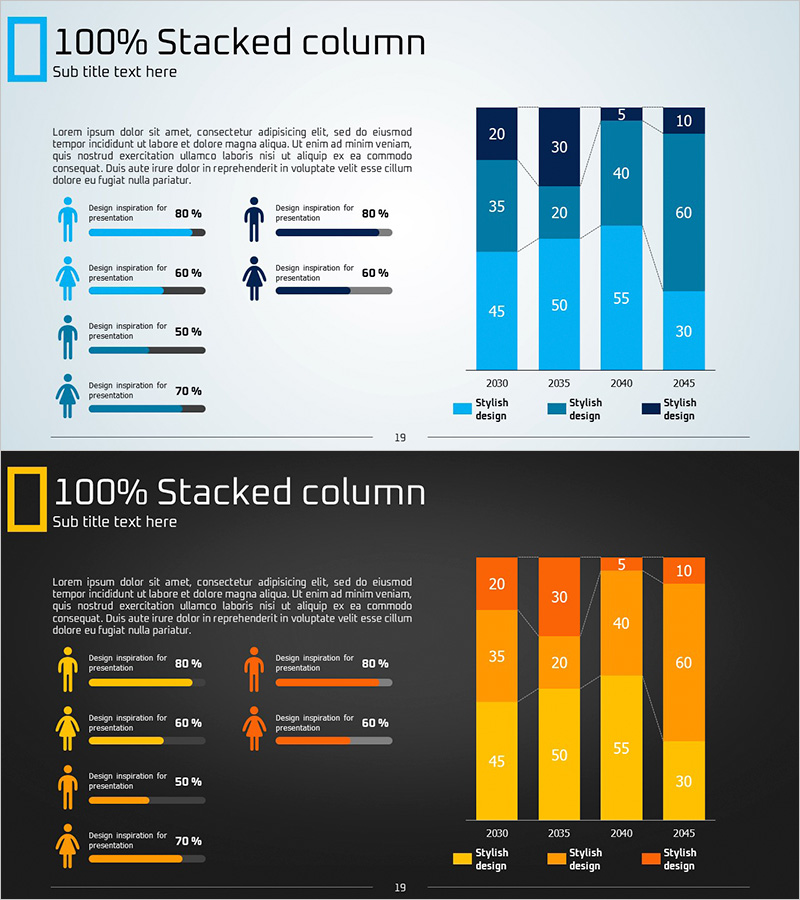
Segmented Vertical Bar Graph Blue Yellow – Customer Analysis and Market Trends
#Market and Competitor Analysis #Graph #Customer Analysis
-
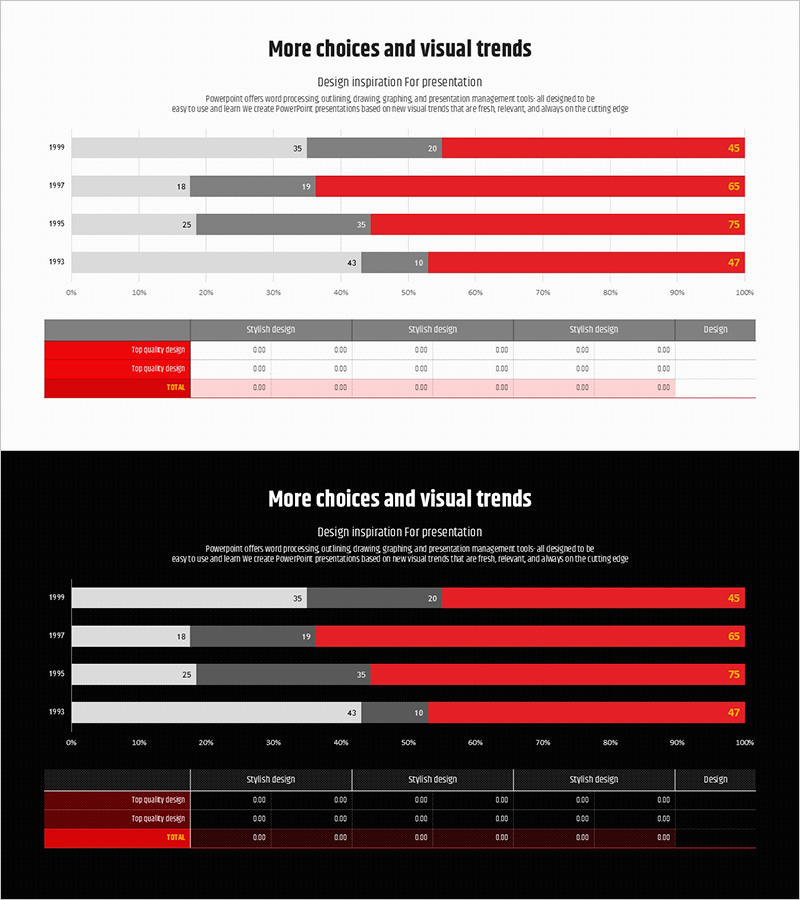
Red Ratio Horizontal Bar Graph – Market Analysis and Trends
#Market and Competitor Analysis #Diagram #Graph
-
Highlighting the Efficacy of Blueberries – Data Visualization and Business Strategy
#Product/Service #Business Promotion Strategy #Diagram
