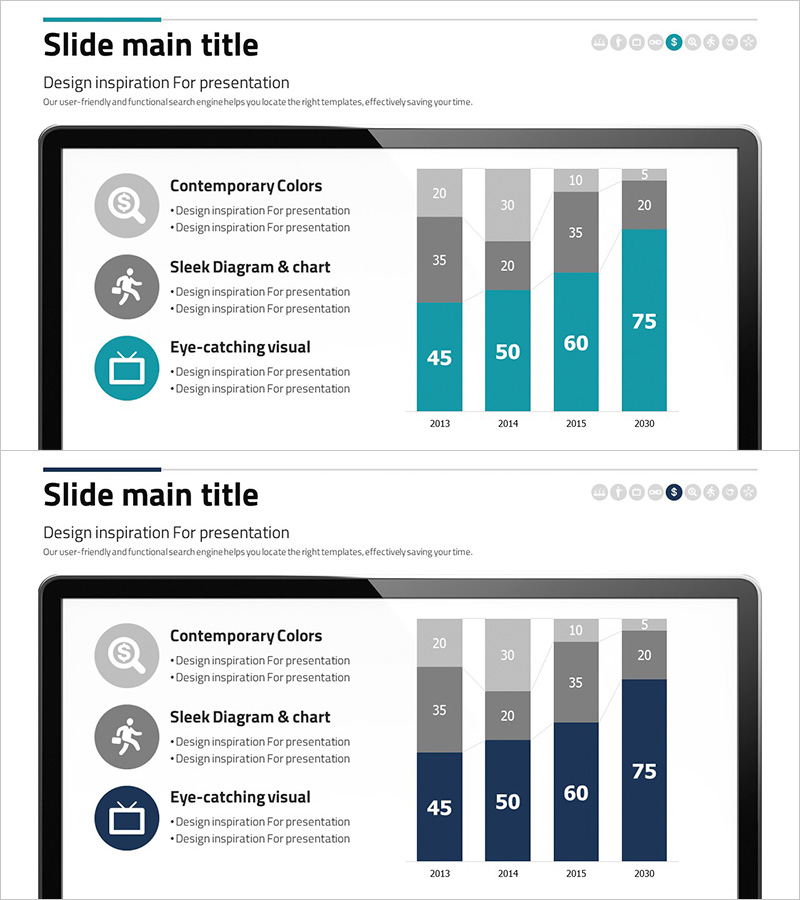
Business Vision and Strategy
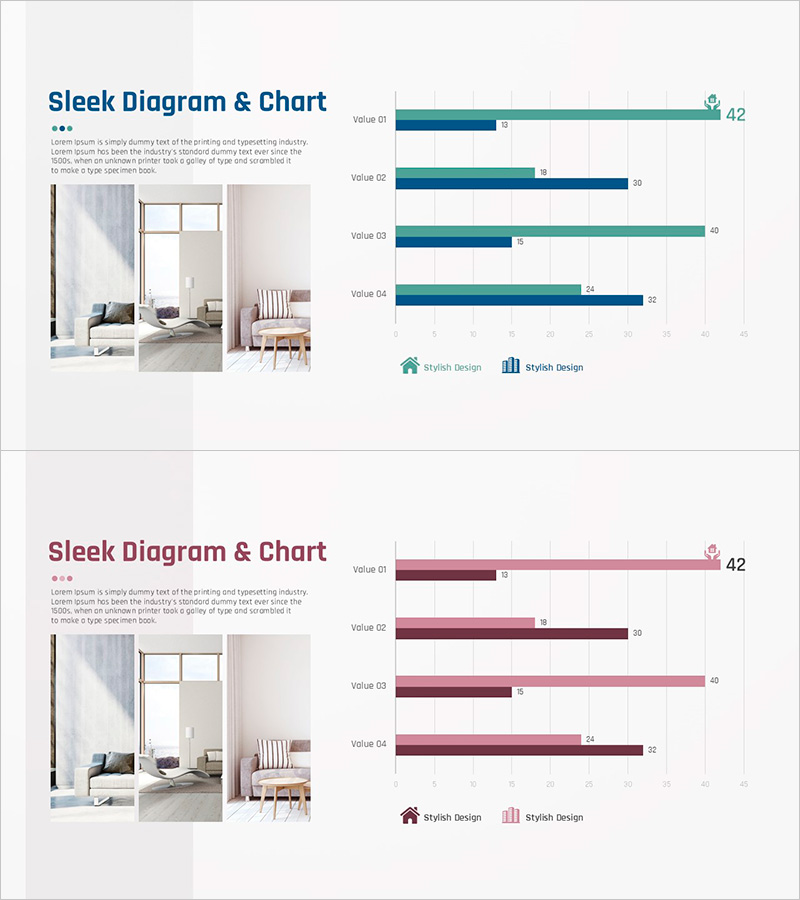
Business Goal Analysis Graph – Realizing Business Vision
RJ0300075_20
- Last Update 12/21/2025
- File Size 1.1MB
- # of Slides 2
- File Format PPTX
- Slide Ratio 16:9
- Color
Keywords
About the Product
This slide utilizes a horizontal bar graph to visually present changes in business goal performance. The sleek color combination of teal and navy conveys stability and trust, while the layout emphasizes clearly separated data areas, making it suitable for presenting diagrammatic information. It can be effectively used for creating analyses related to business strategy formulation and market entry, as it highlights key data points effectively for executive reports or investor presentations. Text and graph components are easy to modify, with an overall editing difficulty set as 'easy', allowing for smooth integration into various presentations.
Related Products
-
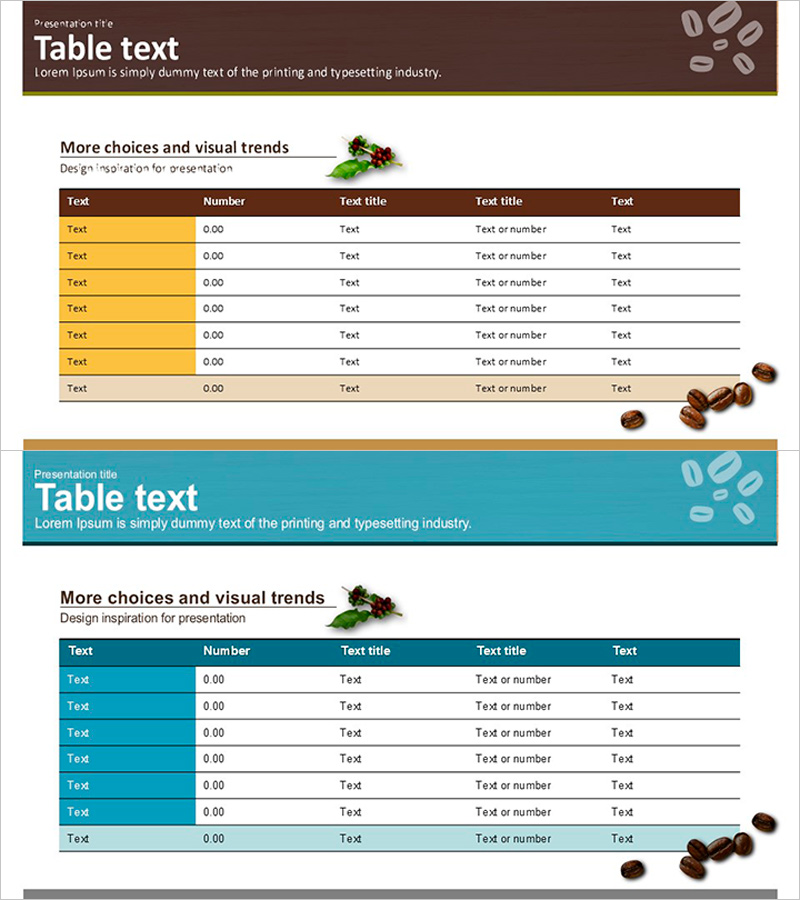
Coffee Bean Template Table – Effective Data Visualization
#Diagram
-
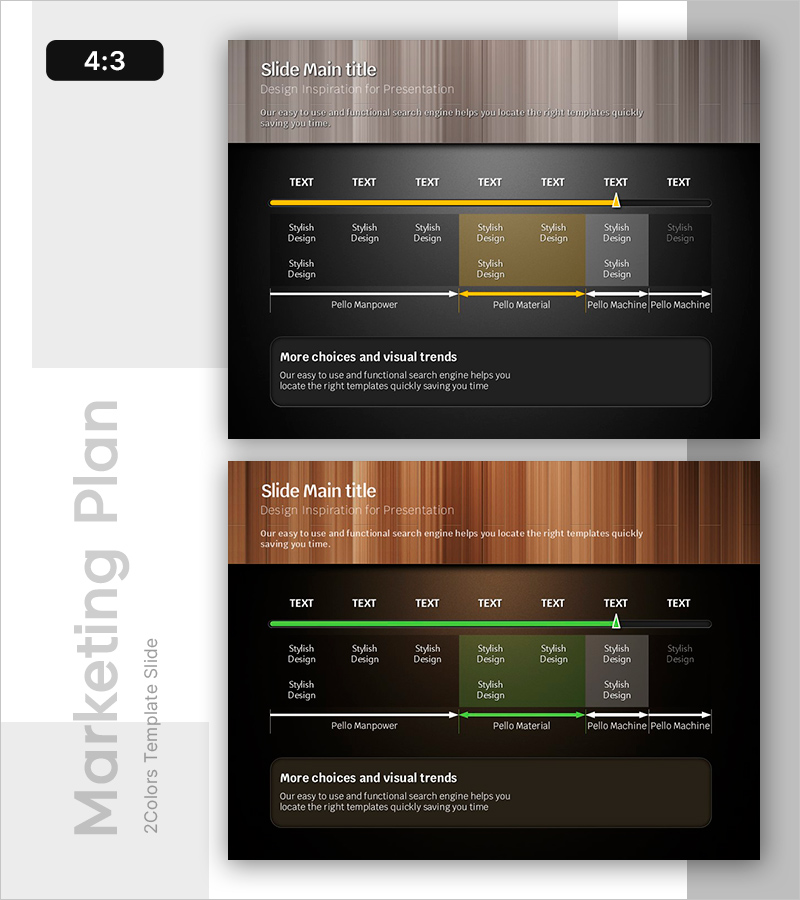
Detailed Schedule System – Presenting Efficient Project Plans
#Business Management #Diagram #Text Box
-
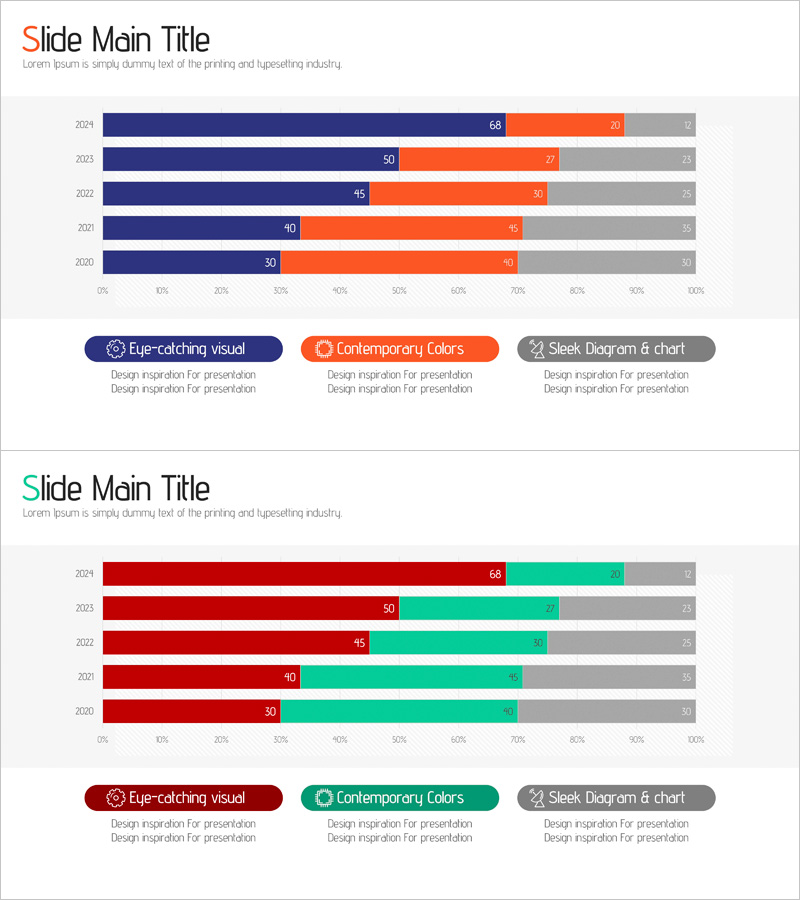
Data Analysis Segmented Bar Graph – Technology Status and Analysis
#Product/Service #Business Introduction #Graph
-
Product Analysis Comparison Graph – Visualizing Market Status
#Market and Competitor Analysis #Graph #Market Status
