Product/Service
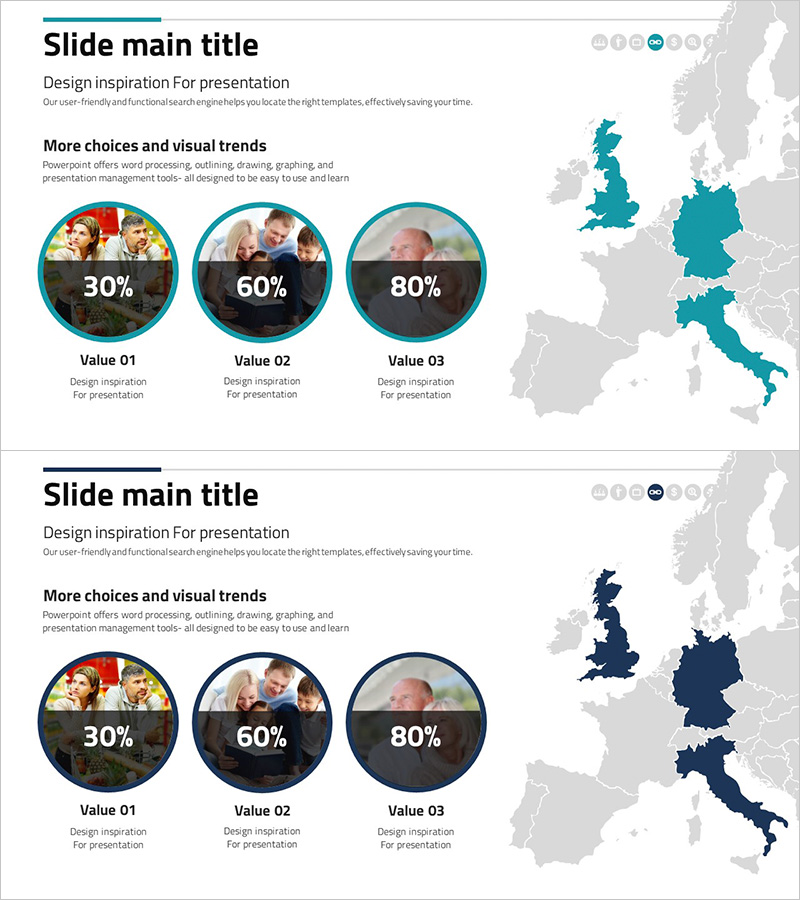
Analysis Graph by Age Group in Europe – Data-Driven Strategy
RJ0300075_19
- Last Update 12/21/2025
- File Size 4.2MB
- # of Slides 2
- File Format PPTX
- Slide Ratio 16:9
- Color
Keywords
About the Product
This slide presents a visual overview of age group analysis in Europe, highlighting the distribution of various age demographics through a graph. The turquoise and navy color palette conveys stability and effectively emphasizes key data points. It is particularly suitable for business proposals and presentations that require understanding of customer segmentation by age for marketing planning strategies. Furthermore, it features easily replaceable text and graphs, with a medium level of editing difficulty for quick and accessible use.
Related Products
-
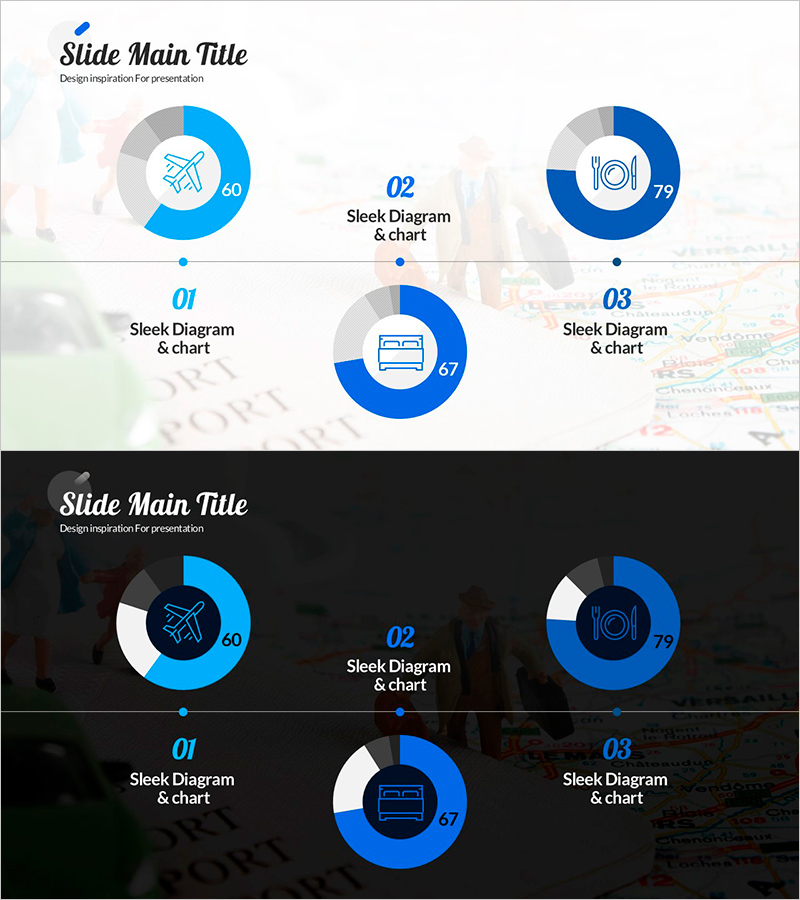
Itinerary Doughnut Graph – Efficient Planning
#Business Management #Market and Competitor Analysis #Diagram
-

Restaurant Blog Slide – Marketing Strategies and Insights
#Marketing Plan and Strategy #Diagram #Marketing Strategy
-
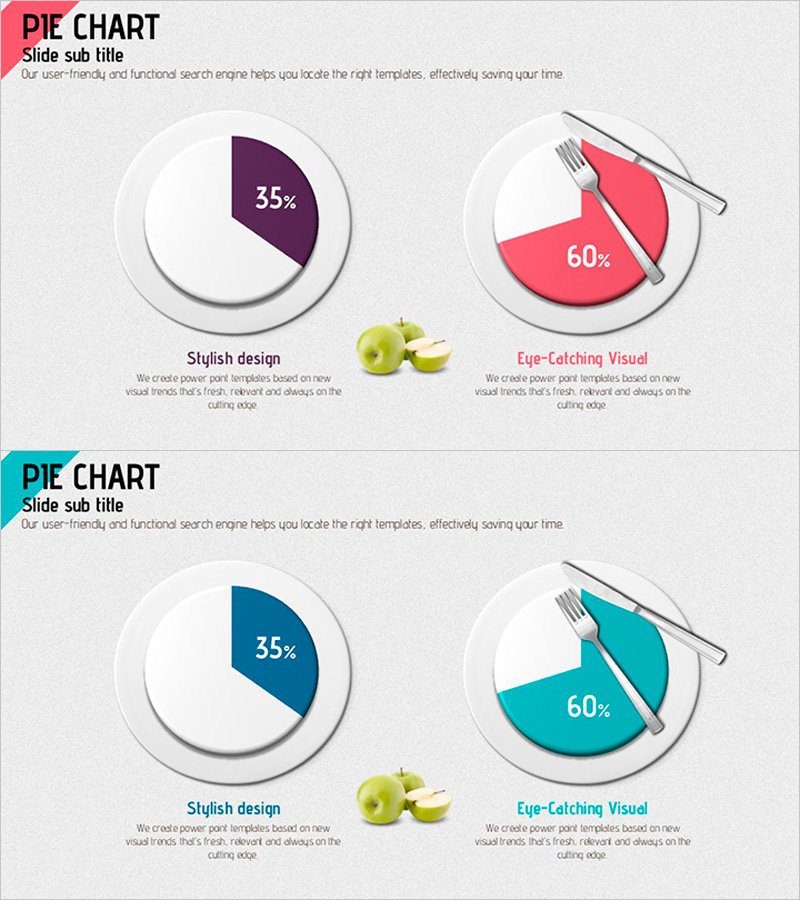
Meal Concept Pie Chart – Market Share Analysis
#Market and Competitor Analysis #Graph #Market Status
-

Interior 3D Mockup and Description – Visualizing Service Composition Innovatively
#Technology Sector #Other #Service Composition
