Market and Competitor Analysis
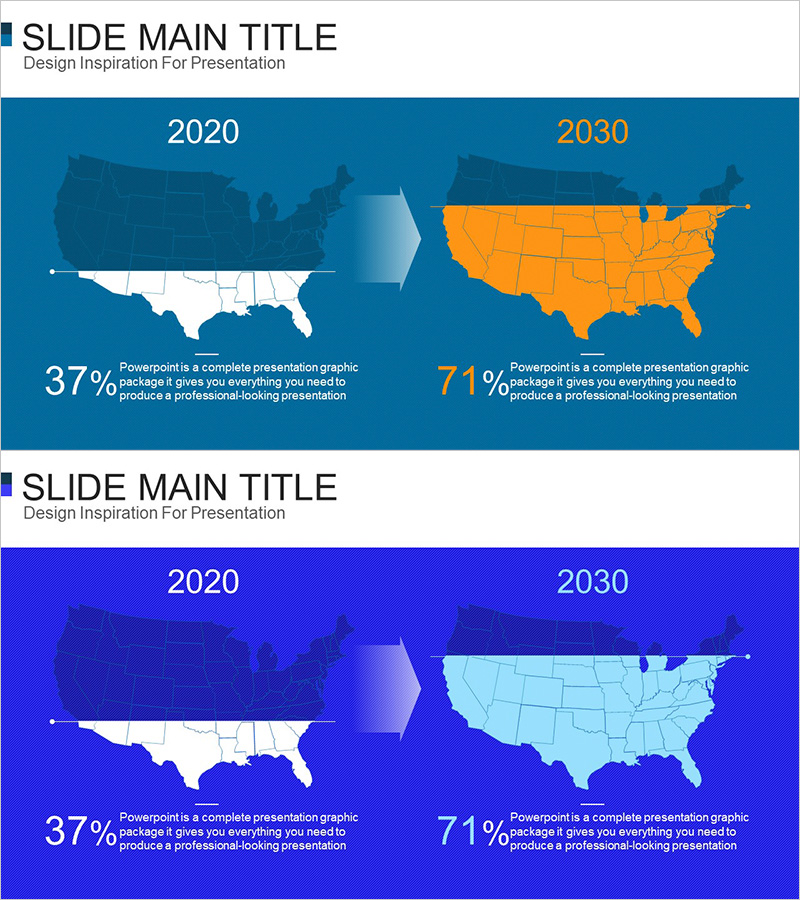
Comparison of Regional Distribution by Year – Market Analysis and Strategy
RJ0300074_25
- Last Update 12/21/2025
- File Size 1MB
- # of Slides 2
- File Format PPTX
- Slide Ratio 16:9
- Color
Keywords
About the Product
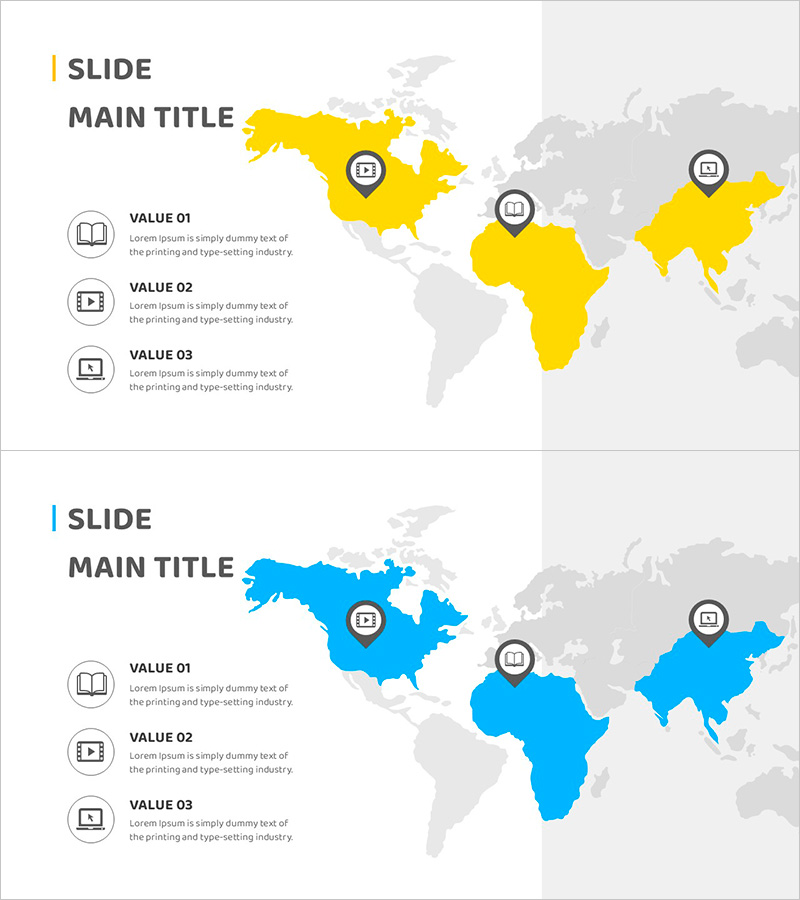
This slide features a template designed for effectively comparing regional distribution over the years. The left side displays the distribution for 2020, while the right side presents a future prediction for 2030, facilitating user understanding. The modern design utilizes a combination of blue and purple hues, ensuring a clean presentation with clear data flow. It provides insights for marketing strategy formulation by showcasing regional data trends and comes with easily editable elements for user convenience.
Related Products
-
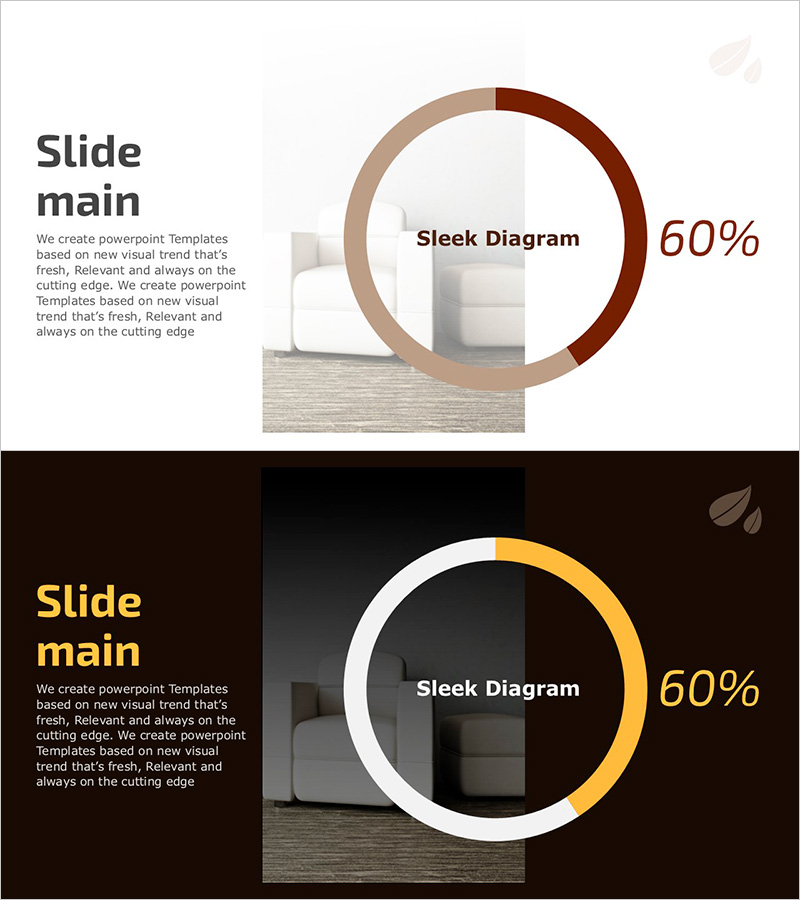
Simple Donut Chart – Data Visualization with Sleek Design
#Graph
-
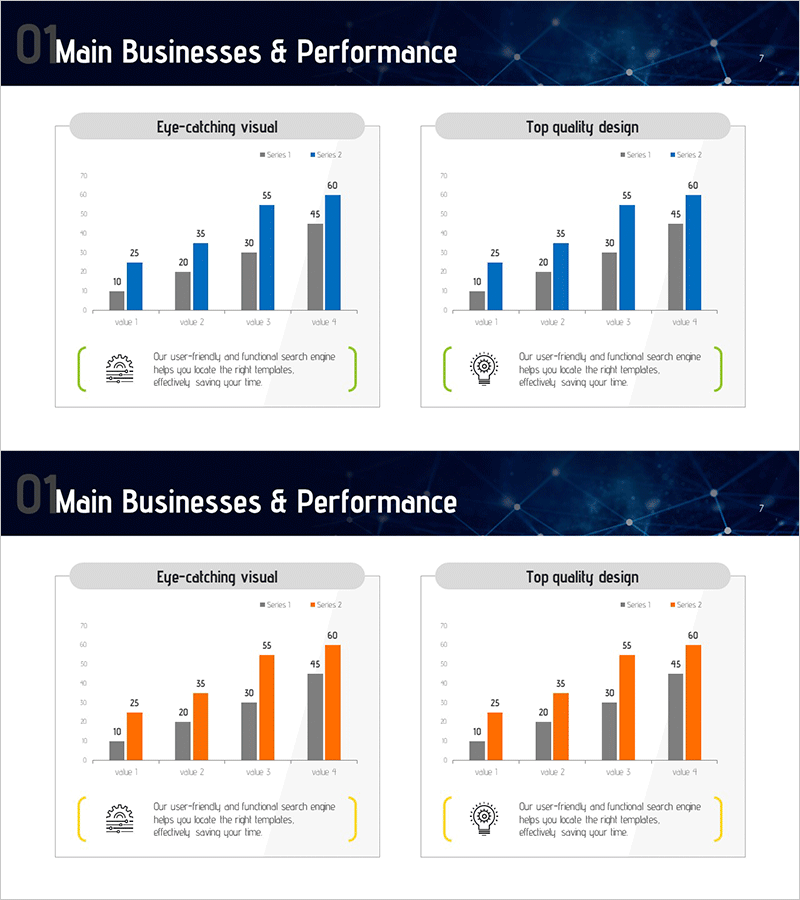
Future Technology Business Analysis Chart – Performance Focus
#Company Introduction #Market and Competitor Analysis #Graph
-
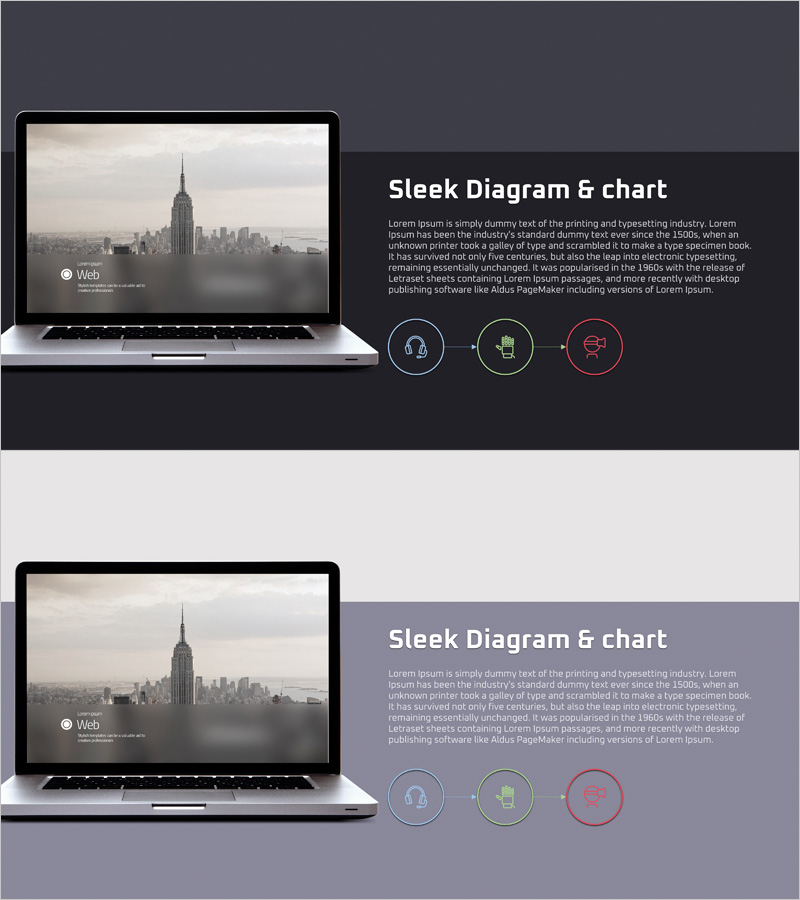
Linear Diagram Slide for VR Business Overview
#Company Introduction #Diagram #Other
-
Slide Visualizing Learning Analysis by Country
#Company Introduction #Market and Competitor Analysis #Other
