Product/Service
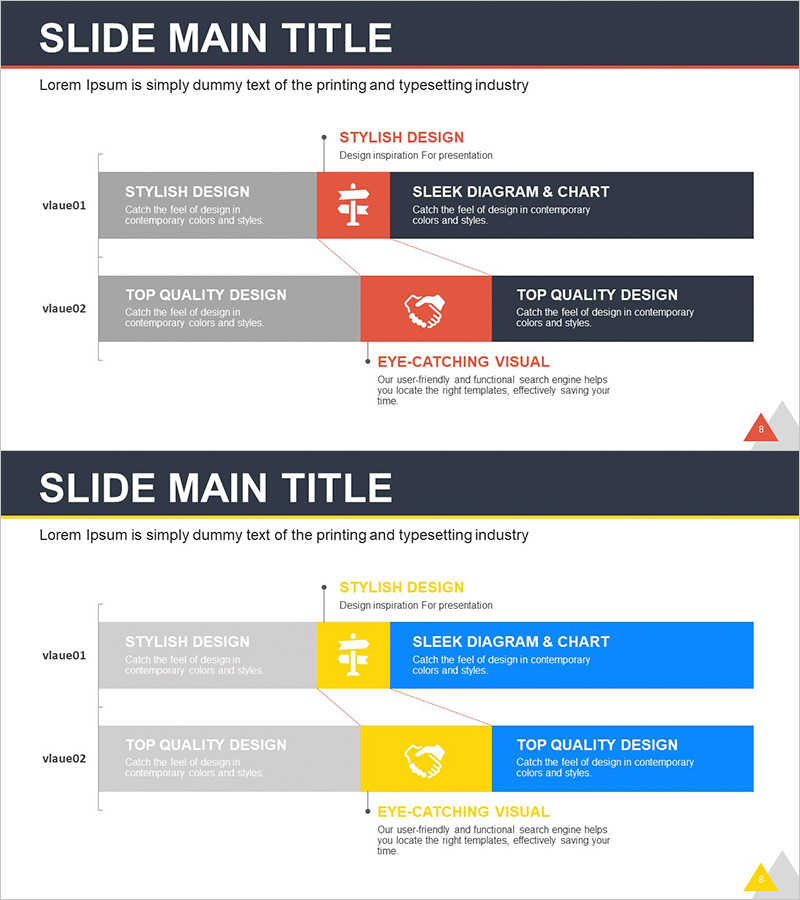
Correlation Analysis Vertical Bar Graph – Visualize Data to Enhance Competitiveness
RJ0300070_7
- Last Update 12/21/2025
- File Size 0.1MB
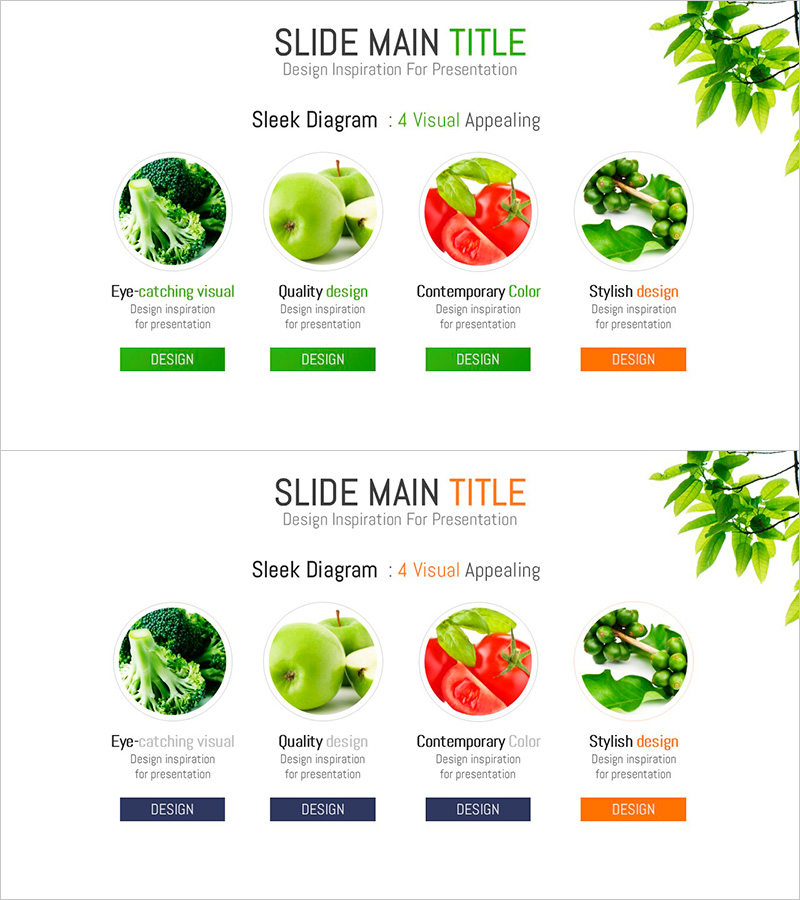
- # of Slides 2
- File Format PPTX
- Slide Ratio 16:9
- Color
Keywords
About the Product
This slide utilizes a vertical bar graph for correlation analysis, effectively visualizing data. The graph features a clean, modern design with a striking combination of red and yellow that enhances attention. It's particularly useful for analyzing product performance, assessing market competitiveness, and reporting technology development status or market share changes. The slide is structured intuitively, making complex data easy to understand during meetings or presentations. Additionally, it is easy to edit, allowing for quick replacement of text and data, with an overall editing difficulty rated as 'easy'.
Related Products
-
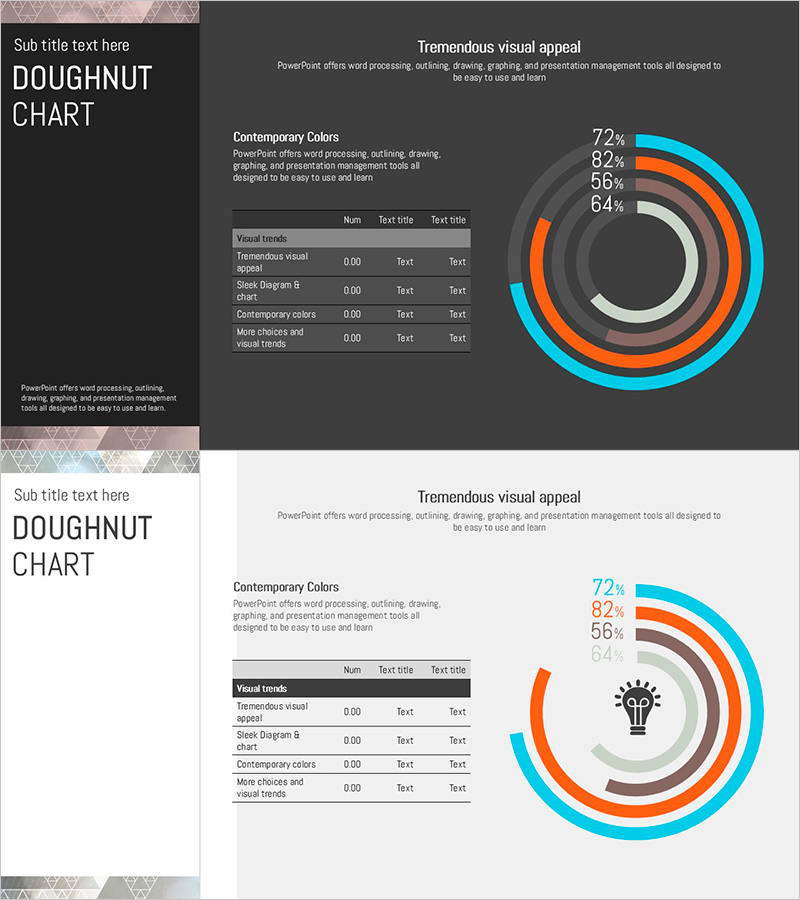
Doughnut Chart for Financial Performance Visualization – Current Technology Status
#Business Introduction #Financial Plans and Performance #Diagram
-
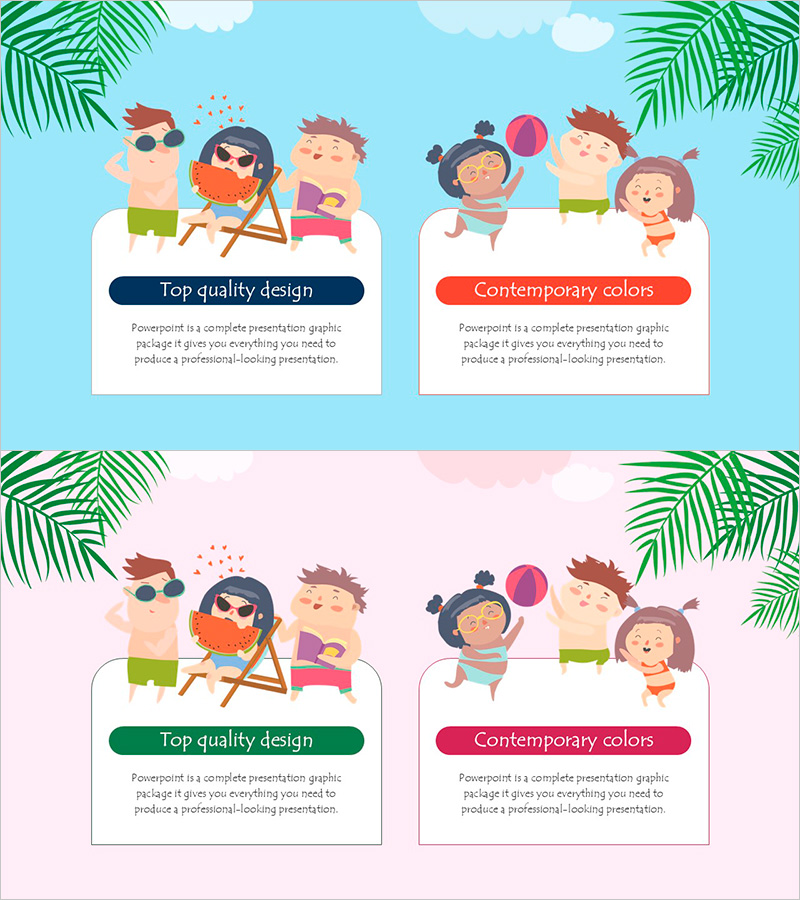
Summer Vacation Template Closure Diagram – Capture the Joy of Summer
#Product/Service #Diagram #Product/Service Introduction
-
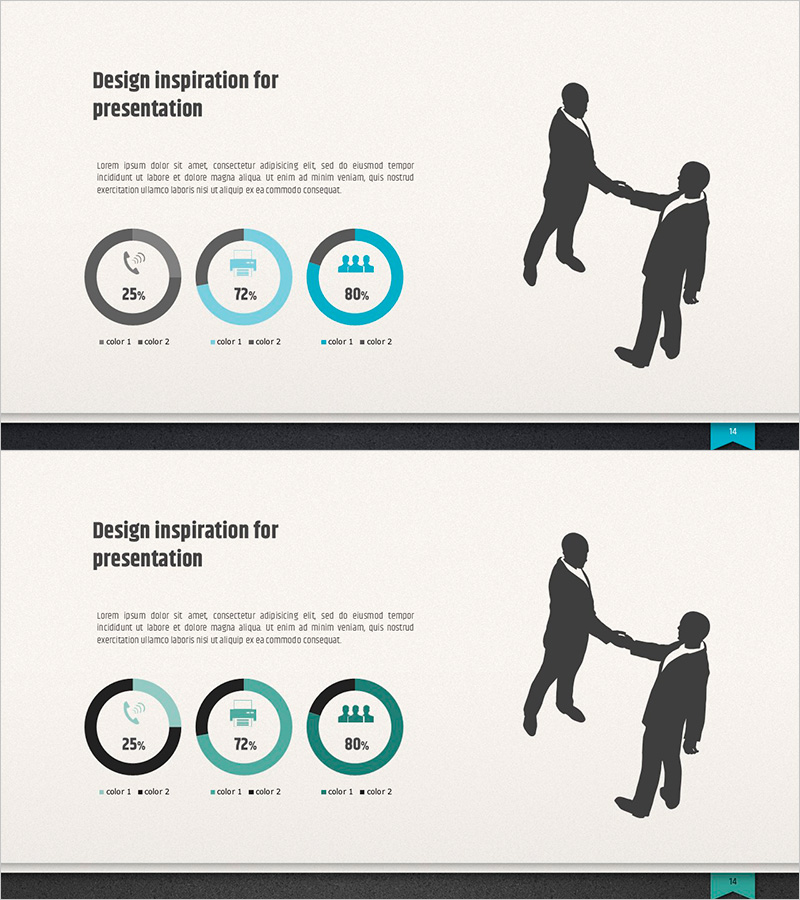
Modern Business Doughnut Chart Template – Visualizing Marketing Strategies
#Marketing Plan and Strategy #Graph #Other
-
Presentation on Organic Food Introduction using Diagrams
#Product/Service #Diagram #Product/Service Introduction
