Product/Service
Manufacturing Analysis Graph – Market and Competitive Analysis
RJ0300069_14
- Last Update 12/21/2025
- File Size 0.7MB
- # of Slides 2
- File Format PPTX
- Slide Ratio 16:9
- Color
Keywords
About the Product
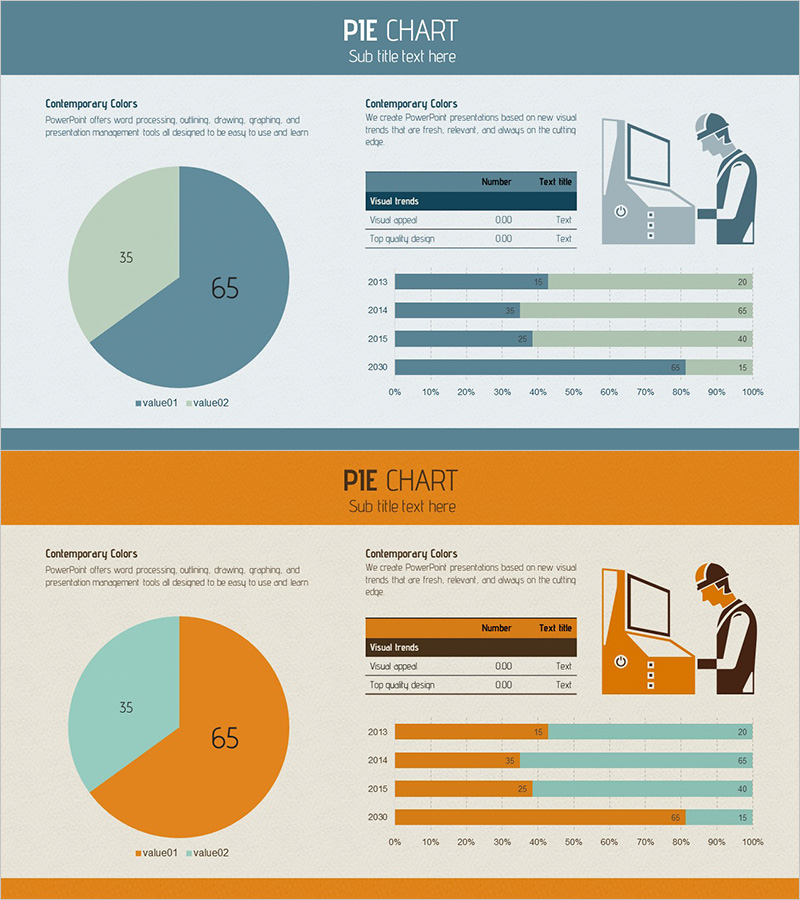
This slide presents a graph designed to effectively convey information related to manufacturing analysis. It utilizes horizontal bar and pie charts for an easy comparison of market and competitors' trends. The turquoise and orange colors create visually appealing data presentations. This template is ideal for market analysis and competitive insight presentation, allowing business professionals and leaders to utilize it effortlessly. The editing difficulty is rated as 'easy', with replaceable elements enabling quick modifications.
Related Products
-
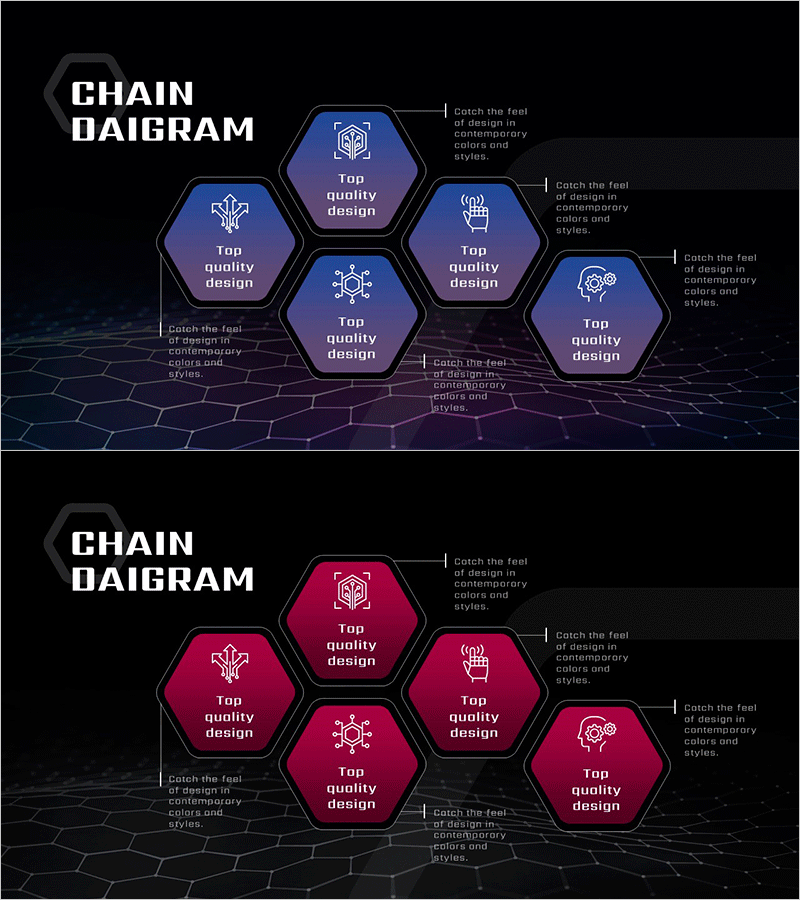
AI Service Key Characteristics Diagram – A Business Tool for Operational Efficiency
#Product/Service #Operation Plan #Diagram
-
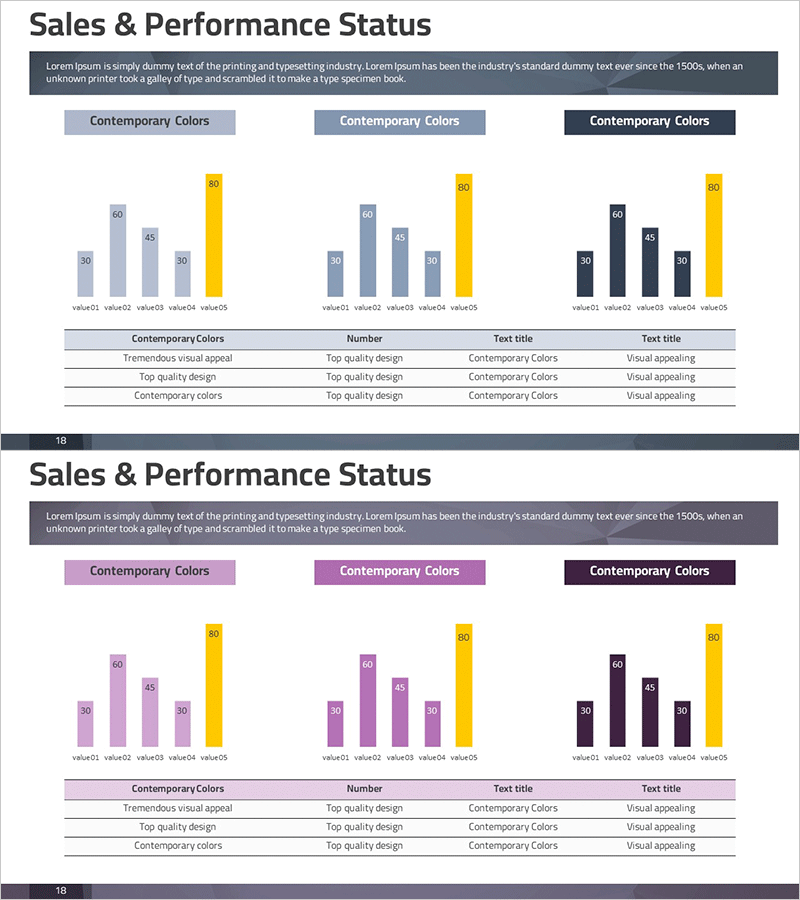
Industry Trends and Market Analysis Charts - Bar and Column Graphs
#Company Introduction #Market and Competitor Analysis #Diagram
-

Introduction to Restaurant Services – Quality and Elegance
#Product/Service #Product/Service Introduction #Product and Service Overview
-
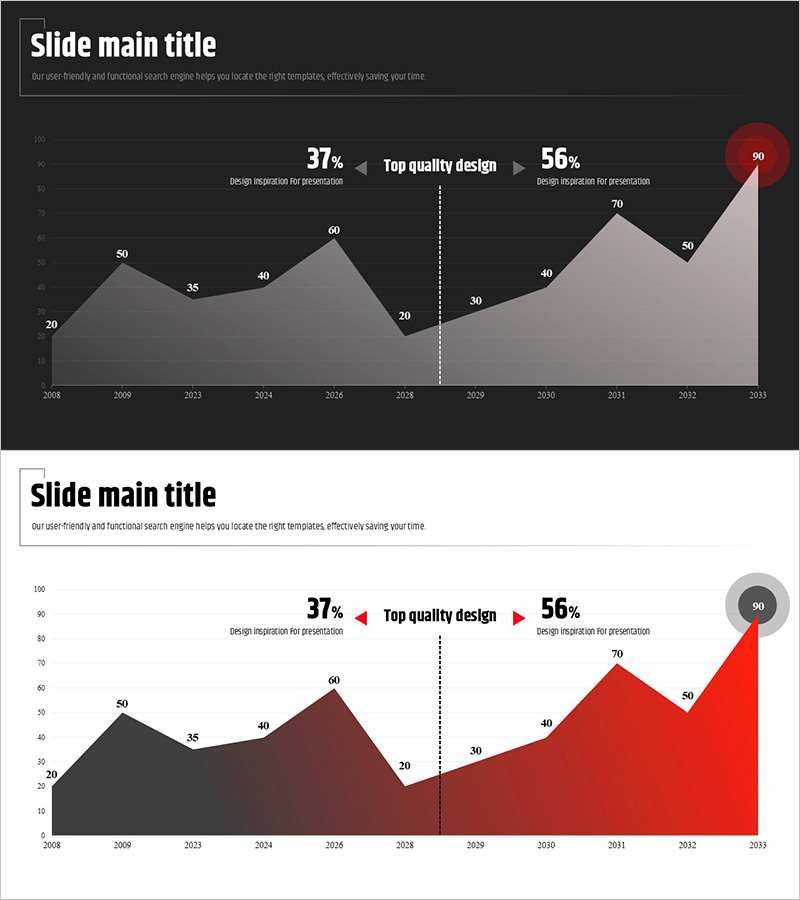
Modern Wide PowerPoint Template Area Chart
#Business Promotion Strategy #Market and Competitor Analysis #Graph
