
Product/Service
Development Status Analysis Donut-Shaped Circle Graph
RJ0300066_24
- Last Update 12/21/2025
- File Size 0.1MB
- # of Slides 2
- File Format PPTX
- Slide Ratio 16:9
- Color
Keywords
About the Product
This slide utilizes a donut-shaped circle graph to effectively analyze the development status of products and services. The harmonious blend of blue and yellow colors stands out, while the layout intuitively presents the title at the top and data at the bottom. This presentation is particularly effective in various business environments such as market and competitor analysis and business planning meetings. The text and graph elements can be easily swapped out, with an editing difficulty rated as 'easy', allowing for immediate implementation.
Related Products
-
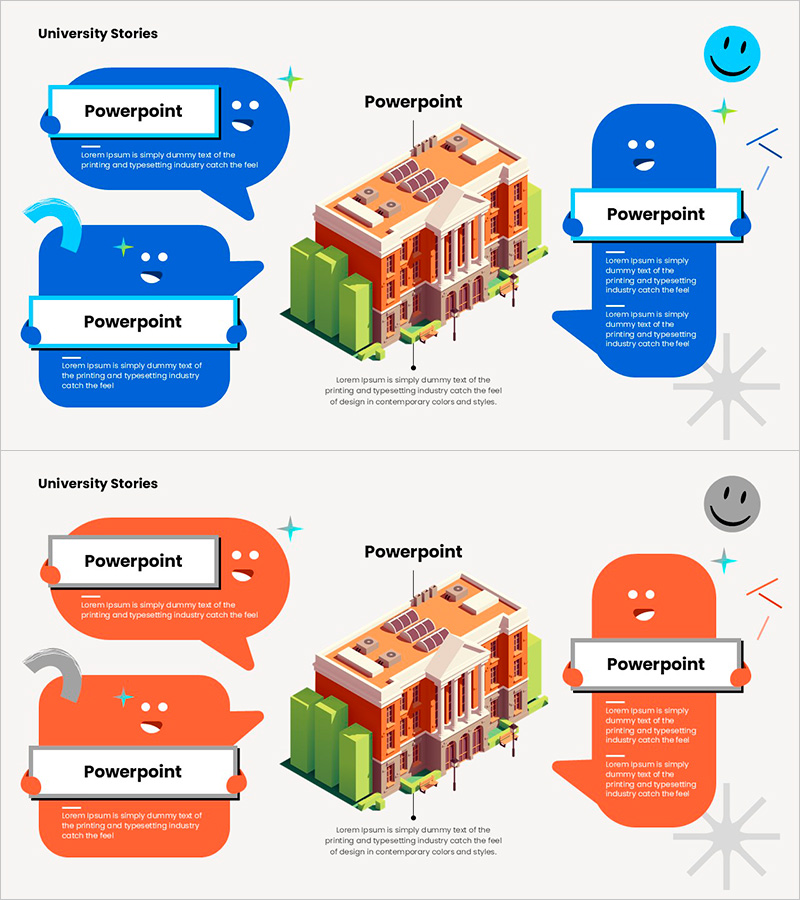
Best Features of Our University – A Slide Showcasing Unique Aspects
#Product/Service #Diagram #Text Box
-
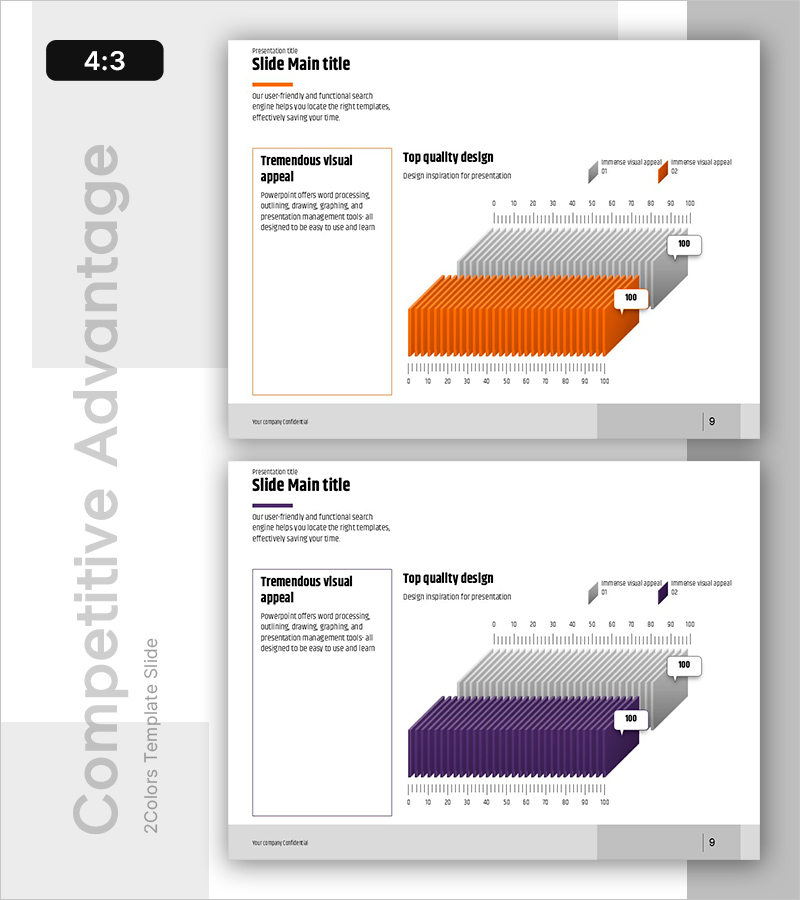
Competition Creative Chart – Essential Tool for Market Advantage
#Market and Competitor Analysis #Graph #Other
-
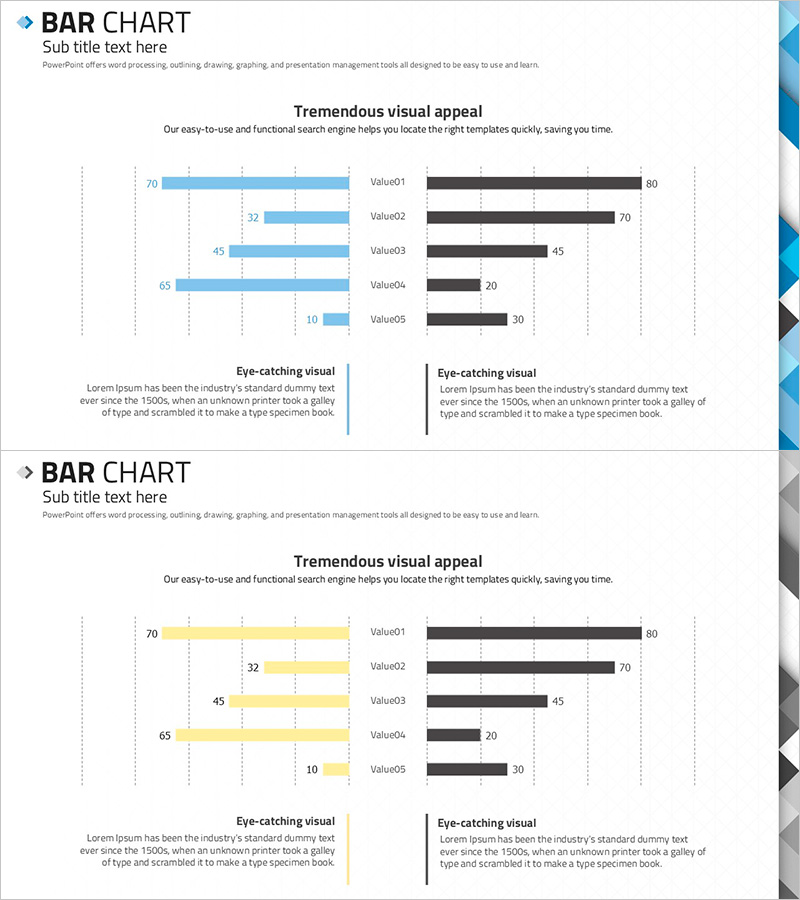
ABSTRACT PATTERN Presentation BAR CHART – Market and Financial Analysis
#Market and Competitor Analysis #Financial Plans and Performance #Graph
-
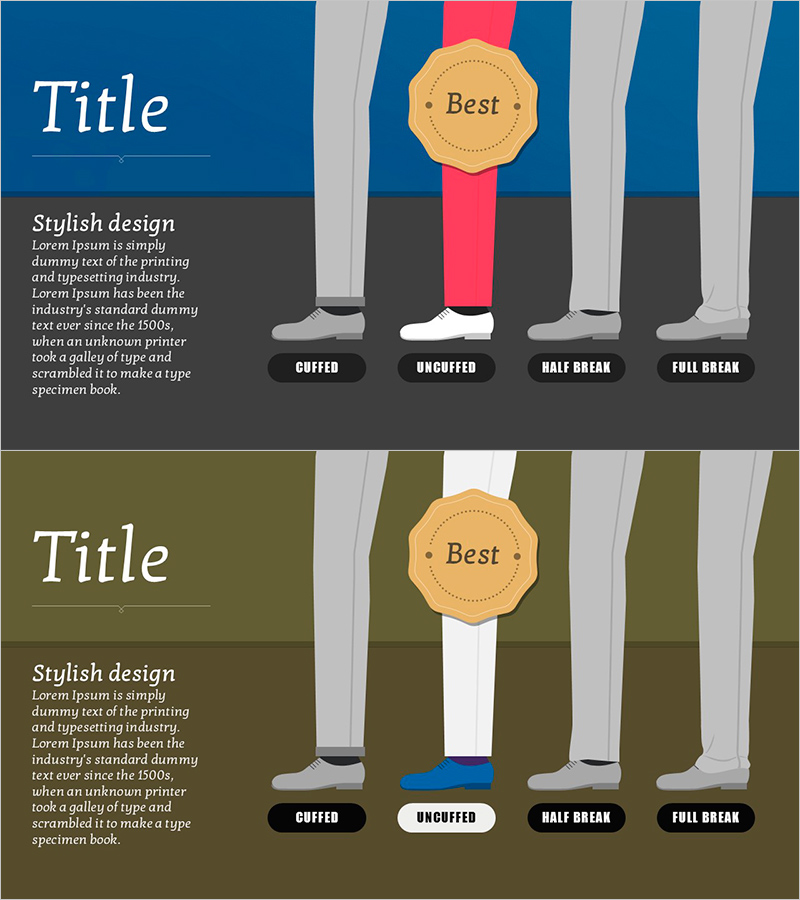
Recommended Men's Shoes – Presentation of Style and Comfort
#Product/Service #Marketing Plan and Strategy #Benefits and Advantages
