Market and Competitor Analysis
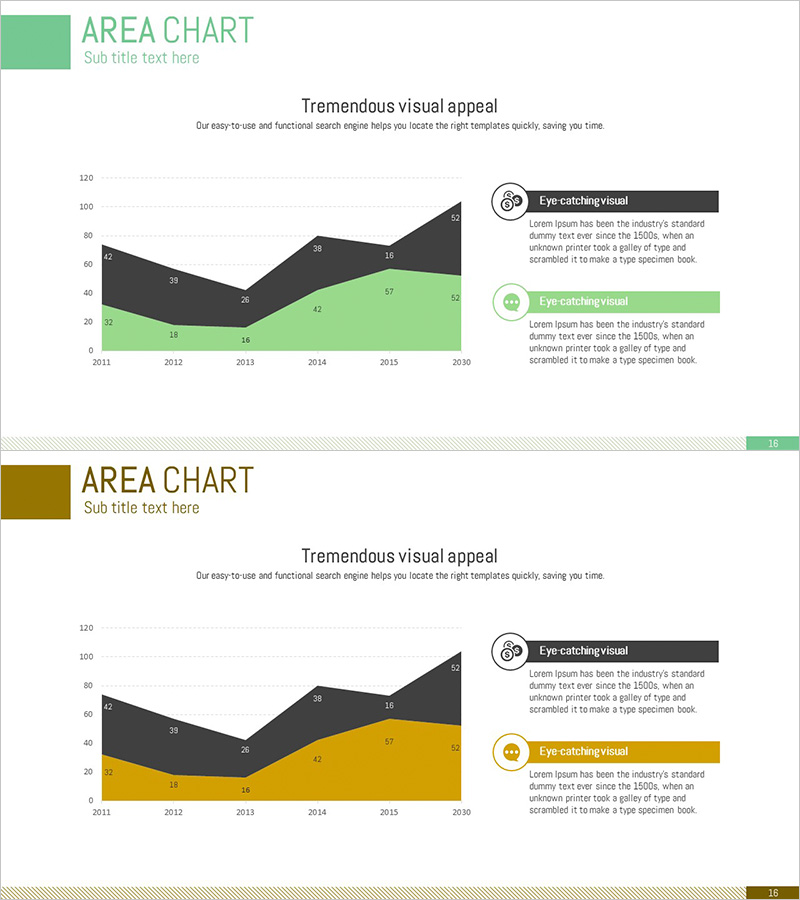
Market Distribution Comparison Graph – Trends and Analysis
RJ0300065_15
- Last Update 12/21/2025
- File Size 0.8MB
- # of Slides 2
- File Format PPTX
- Slide Ratio 16:9
- Color
Keywords
About the Product
This slide features a market distribution comparison graph designed to visually convey data and effectively analyze competitors and market trends. The graph's design provides visual stability and flexibility, allowing easy identification of separated data points through various colors. Primary colors of green, yellow, and brown are employed to highlight market shares. It is especially suitable as a crucial component in business reports for understanding market dynamics. The text and data areas are easy to modify, with an overall editing difficulty rated as 'moderate'.
Related Products
-

Blue Line Wide Template for Operational Planning Visualization – Efficient Maintenance
#Operation Plan #Technology Sector #Diagram
-
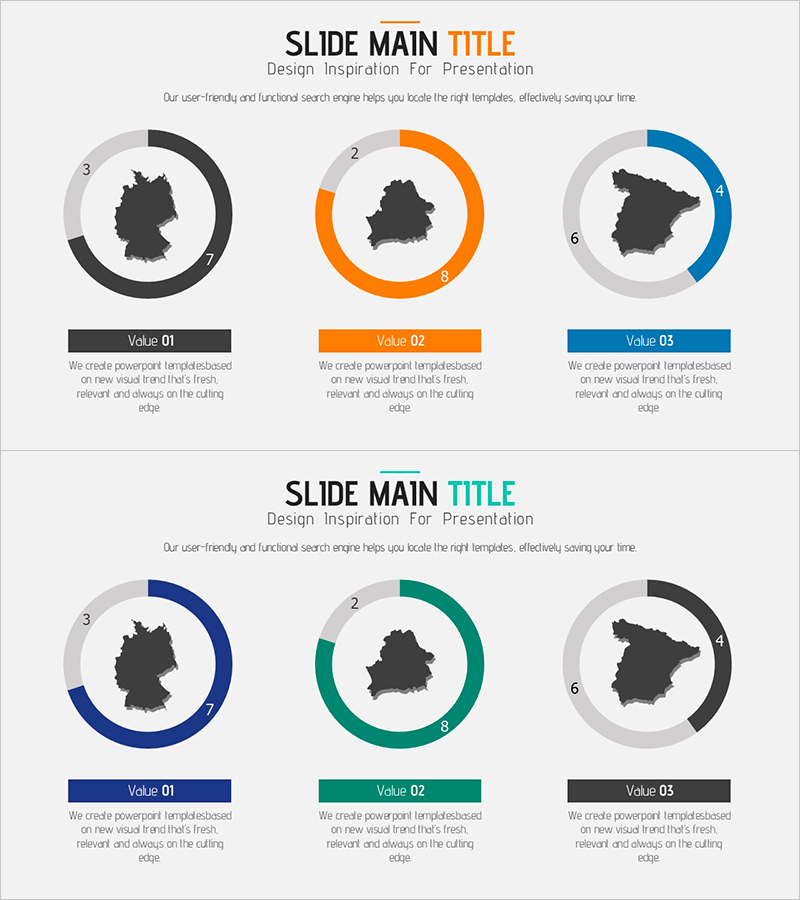
National Analytical Donut Chart – Market Share and Insights
#Market and Competitor Analysis #Graph #Market Share
-
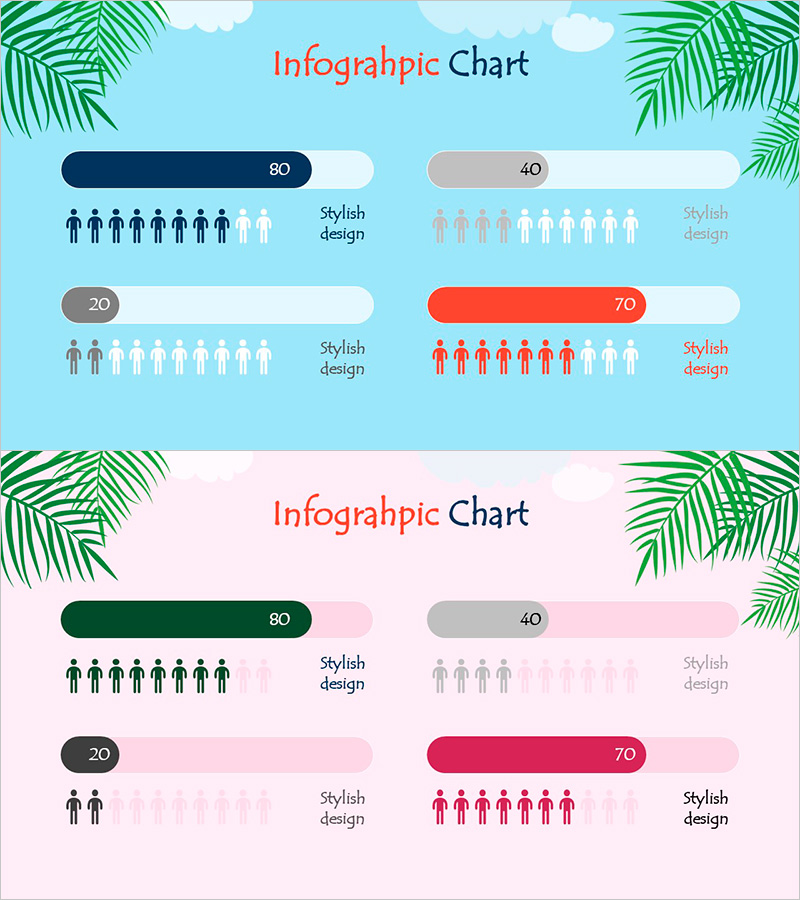
Horizontal Bar Charts for Customer Analysis – Summer Vacation Template
#Market and Competitor Analysis #Graph #Other
-

Blood Donation Business Sector Tree Diagram – Connecting Health and Life
#Company Introduction #Diagram #Company Overview
