Business Introduction
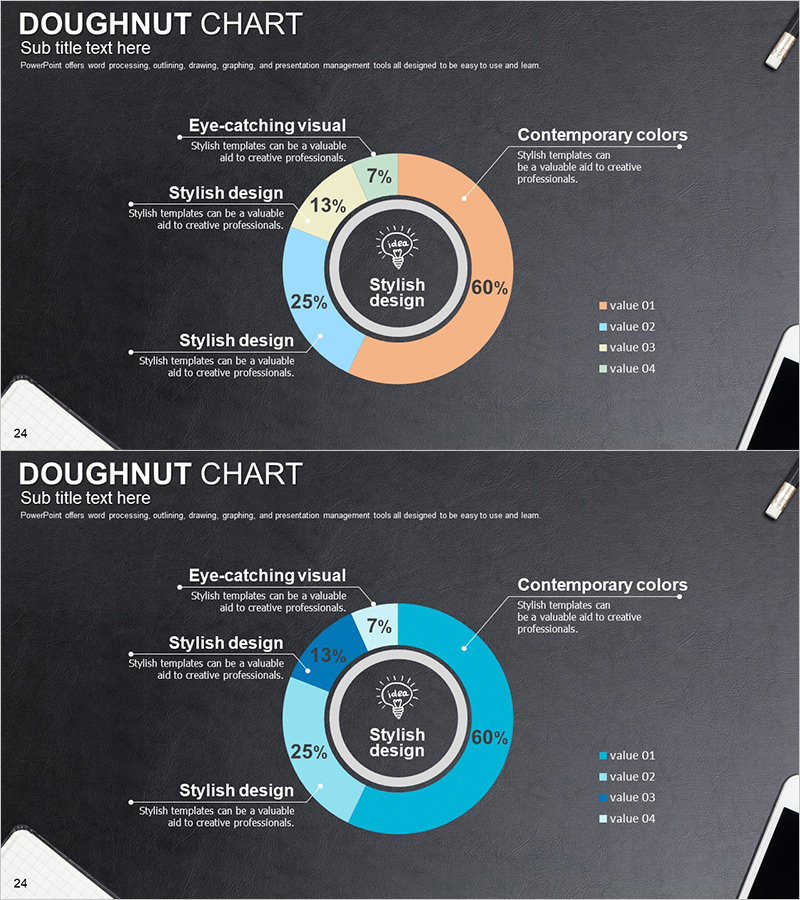
Idea Development Status Graph – Stylish Donut Chart for Market Analysis
RJ0300063_23
- Last Update 12/21/2025
- File Size 4.4MB
- # of Slides 2
- File Format PPTX
- Slide Ratio 16:9
- Color
Keywords
About the Product
This slide features a donut chart designed to visually emphasize the status of idea development. With a modern color scheme of black, blue, and orange, it provides an intuitive and captivating visual presentation. It is ideal for showcasing market share and technology status data analyses, perfect for business proposals or technical documents. The linear and concise layout effectively conveys critical information. Furthermore, this slide allows easy customization of text and data sections for quick adaptation into various presentations.
Related Products
-
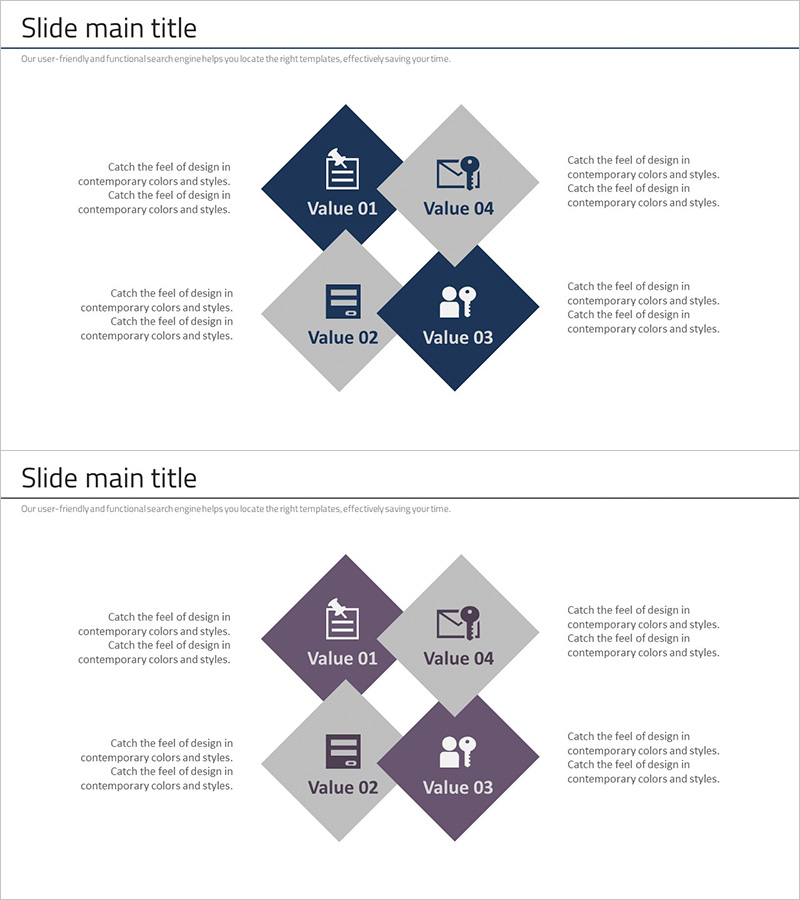
Security Business Area Diagram – Cluster Visualization for Business Presentation
#Company Introduction #Business Introduction #Diagram
-

SNS Market Trend & Customer Analysis - Insights Covering Market and Customers
#Market and Competitor Analysis #Marketing Plan and Strategy #Diagram
-
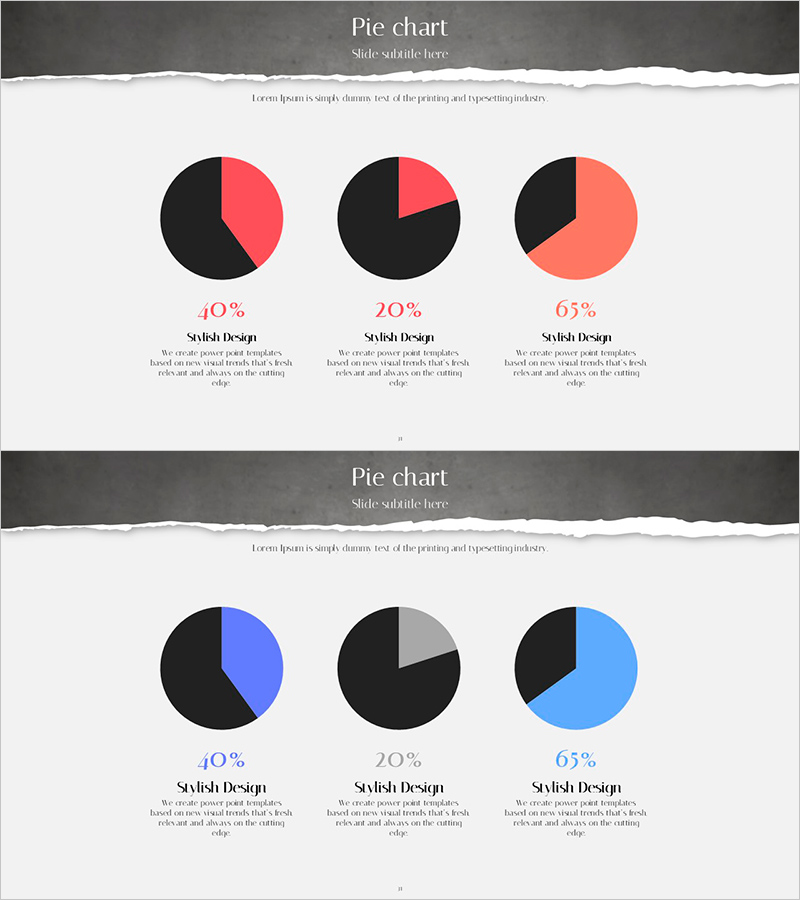
Black & Red Purple Donut Chart – Trendy Data Visualization
#Graph
-
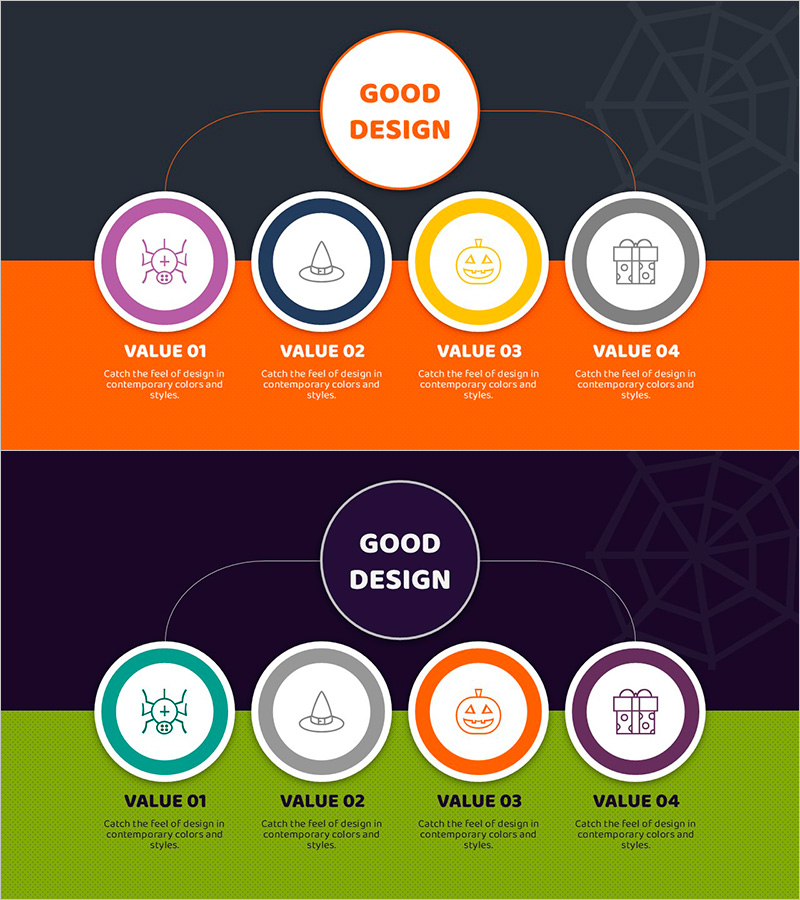
Diagram Slide Visualizing Spider Silk and Circular Tree Structure
#Business Introduction #Diagram #Business Overview
