Market and Competitor Analysis
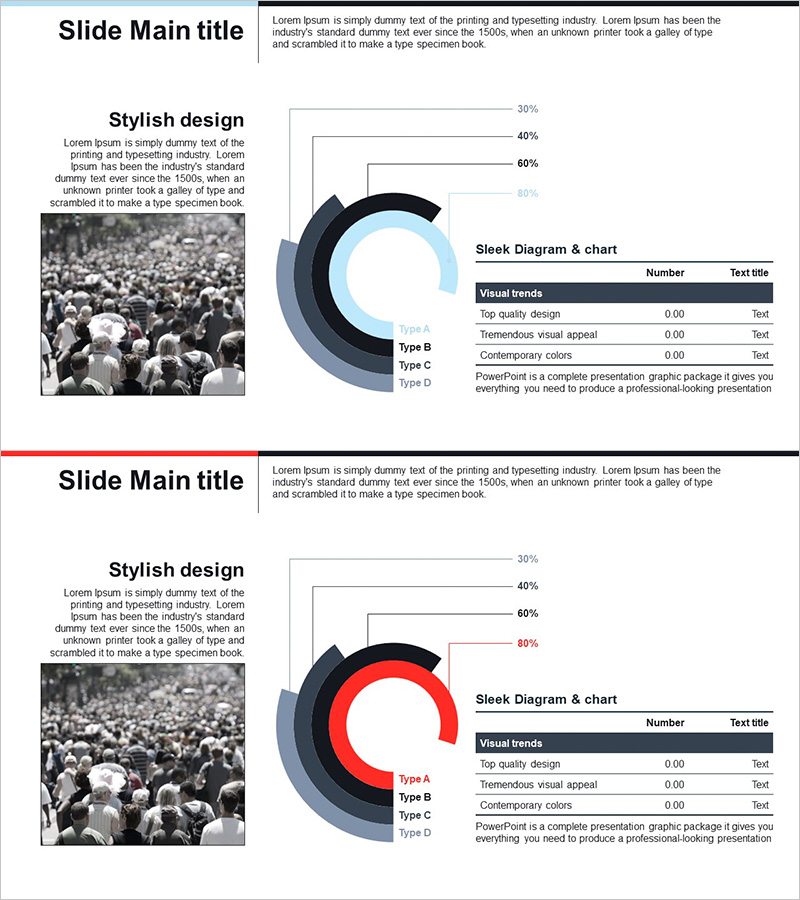
Type Comparison Analysis Graph & Table – Effective Tool for Market Analysis
RJ0300062_13
- Last Update 12/21/2025
- File Size 0.3MB
- # of Slides 2
- File Format PPTX
- Slide Ratio 16:9
- Color
Keywords
About the Product
This slide offers a graph and table for type comparison analysis, optimized for market and competitive analysis. The visual elements include pie and doughnut charts that clearly communicate the proportions of each type. The sleek design enhances the clarity of data, aiding in the creation of effective presentations. The color scheme, featuring blue and red, establishes a strong visual contrast, effectively highlighting key data points.
Related Products
-
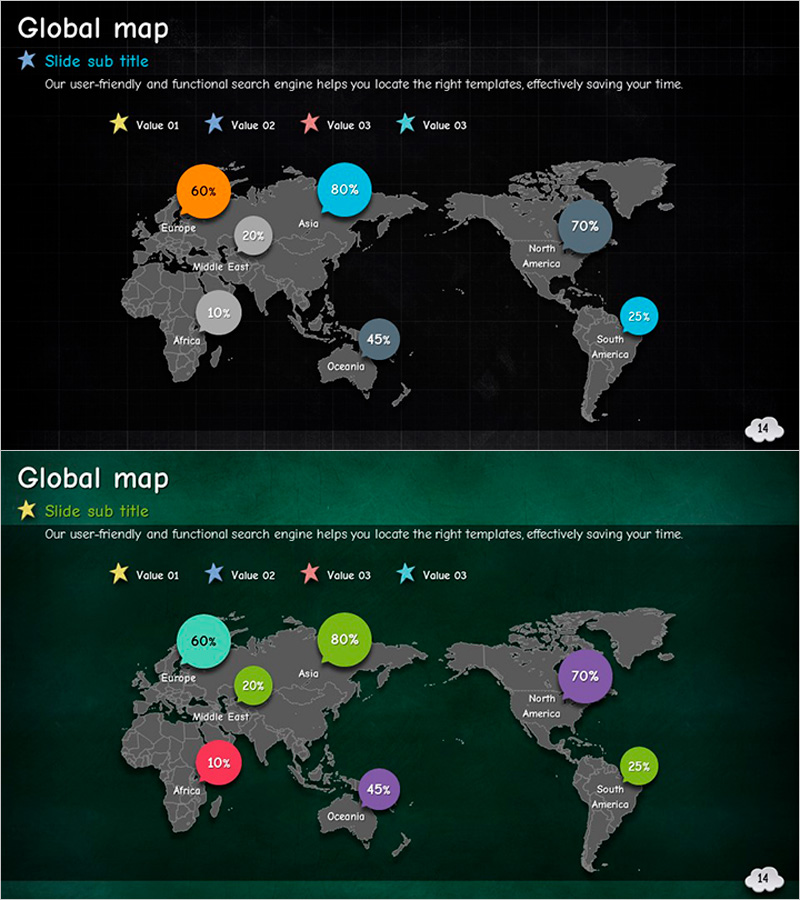
Market Analysis with World Map and Percentage Data
#Market and Competitor Analysis #Other #Market Share
-

Future System Differentiation Strategy – Service Development Direction
#Product/Service #Business Promotion Strategy #Diagram
-
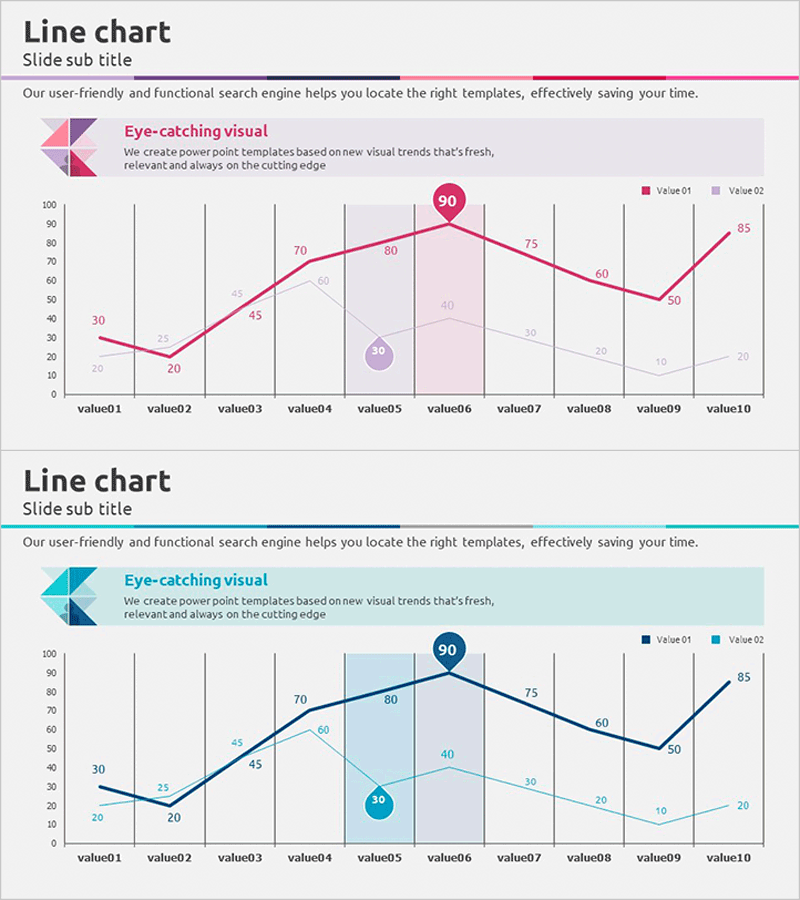
Wide Graph Presentation with Triangle Pattern
#Market and Competitor Analysis #Marketing Plan and Strategy #Graph
-
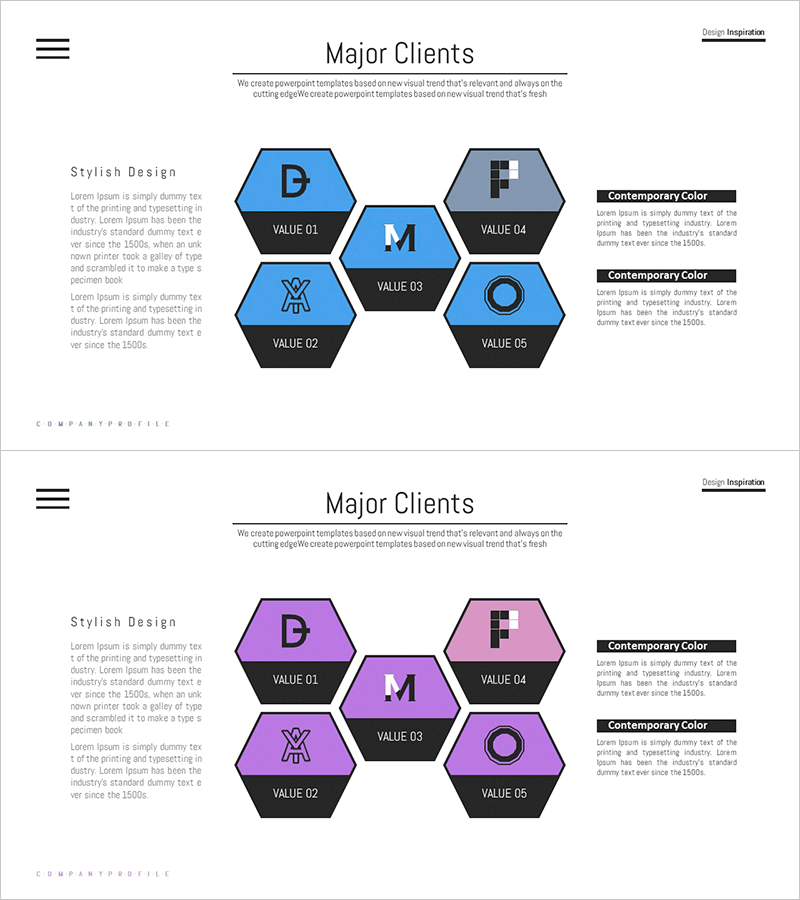
Hexagonal Piece Diagram for Major Clients Introduction
#Customer Success Stories #Diagram #Introduction of Key Customers
