Market and Competitor Analysis
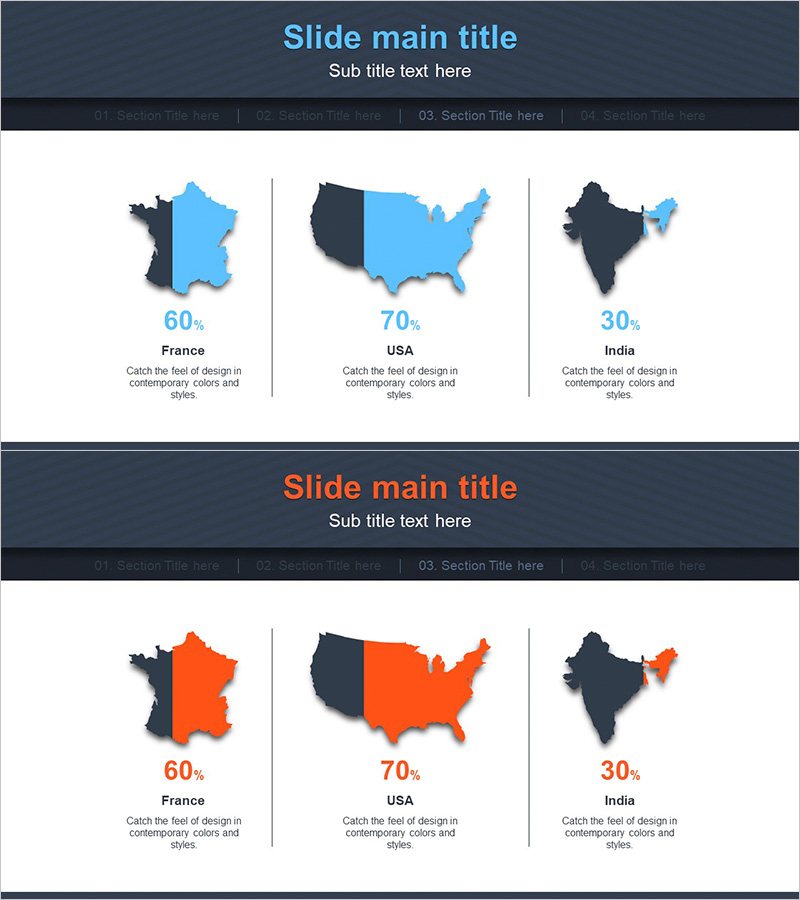
Target Country Distribution Graph – Strategic Visualization for Market Analysis
RJ0300061_24
- Last Update 12/21/2025
- File Size 0.2MB
- # of Slides 2
- File Format PPTX
- Slide Ratio 16:9
- Color
Keywords
About the Product
This slide features a graph visually representing the distribution of target countries. The contrast of blue and orange effectively conveys essential data, making it useful for analyzing market trends and consumer behavior. With data from three countries (France, USA, India) presented in two colors, this slide organizes information efficiently. It serves as a vital tool for formulating marketing strategies, allowing presenters to deliver clear insights based on the data.
Related Products
-
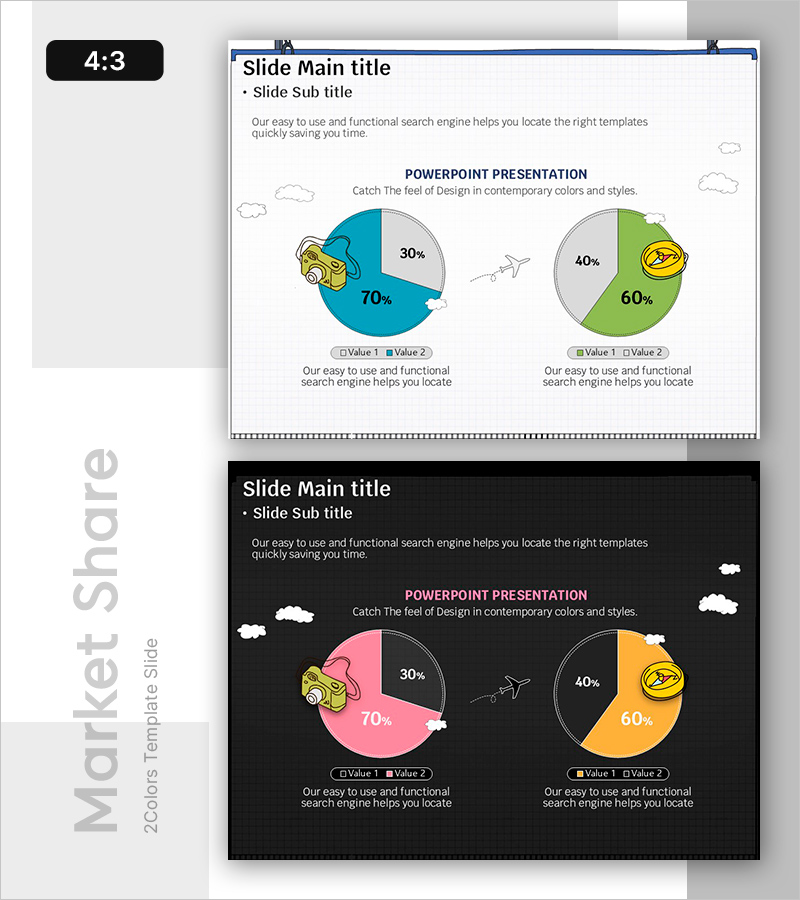
Travel Survey Results – Market Share Visualization
#Market and Competitor Analysis #Graph #Market Status
-
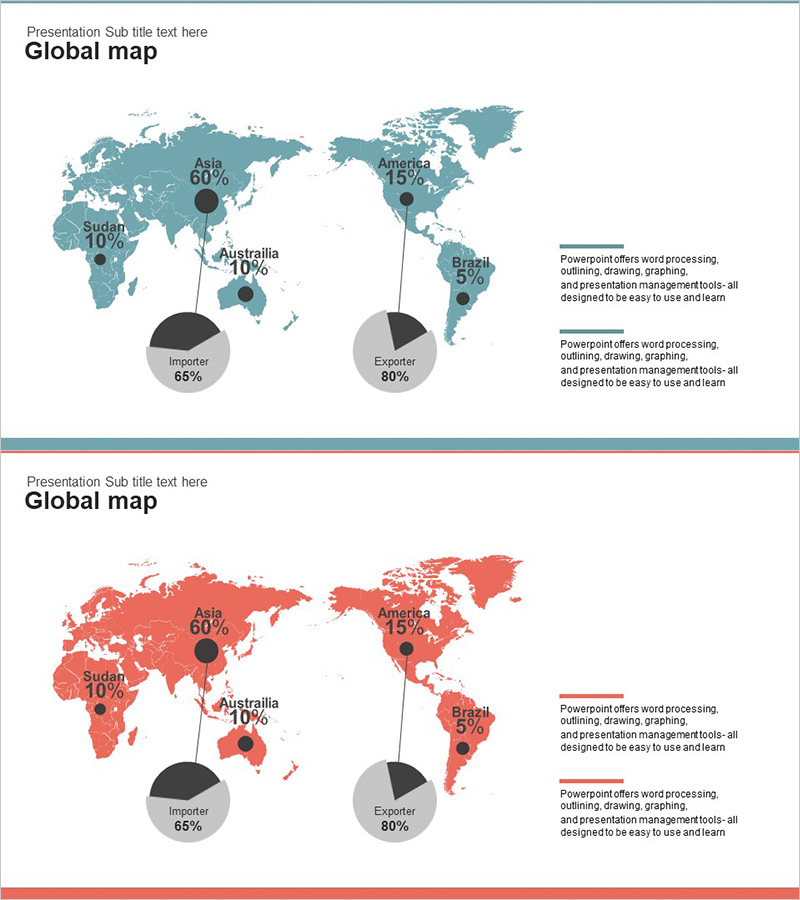
Global Goal Achievement Rate Visualization – Insights Through Market Analysis
#Company Introduction #Market and Competitor Analysis #Graph
-

Network Solution Demonstrated on Tablet – Stylish Design
#Business Vision and Strategy #Diagram #Other
-
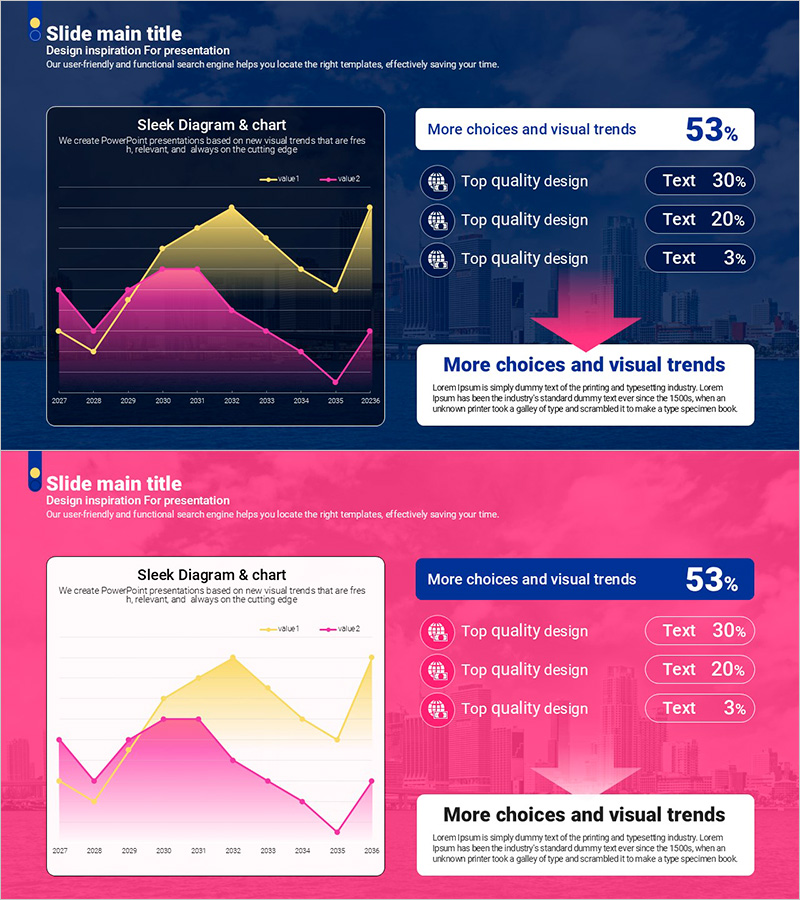
Curved Theme Purple Template Area Chart – Market Trend Analysis
#Market and Competitor Analysis #Graph #Future Outlook
