Product/Service
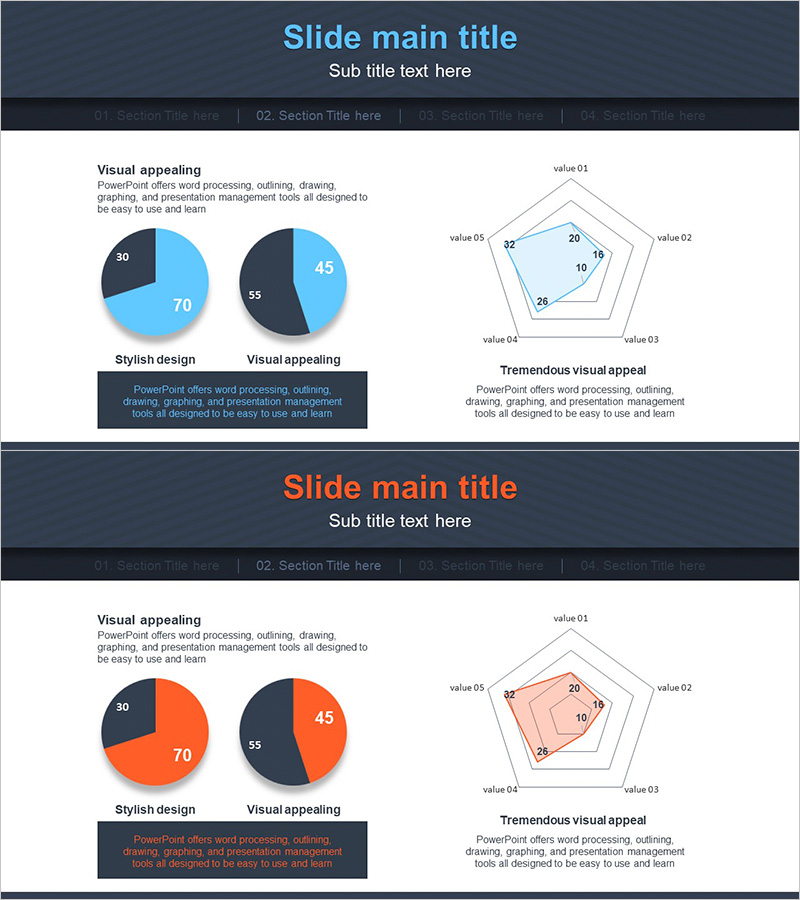
Market Share Analysis Area & Pie Chart – The Power of Data Visualization
RJ0300061_16
- Last Update 12/21/2025
- File Size 0.9MB
- # of Slides 2
- File Format PPTX
- Slide Ratio 16:9
- Color
Keywords
About the Product
This slide effectively visualizes market share analysis using area and pie charts. It presents data and proportions intuitively, making it suitable for business strategy and market trend analysis. The slide maximizes its visual appeal through vibrant blue and orange colors, guiding the data flow naturally. Ideal for the opening of presentations or analytical reports, it is easy for users to edit, with an overall editing difficulty rated as moderate.
Related Products
-

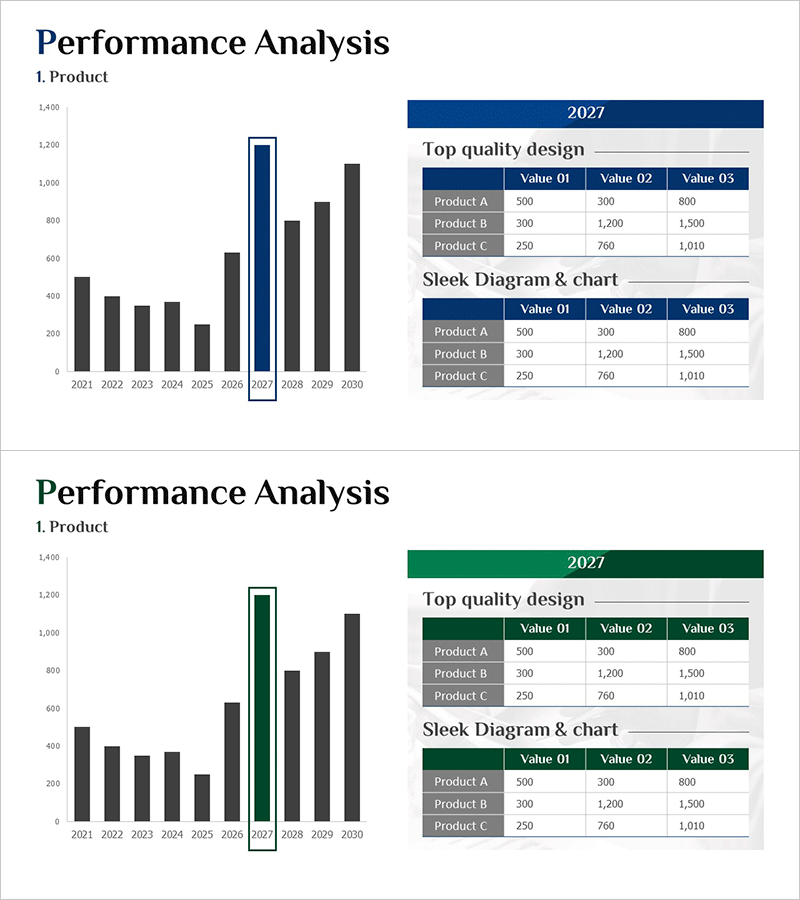
Year-by-Year Analysis Graph & Business Strategy – Market Trends and Growth
#Business Vision and Strategy #Market and Competitor Analysis #Graph
-
Product Top Sales Analysis Graph – Market and Competitor Analysis
#Business Promotion Strategy #Market and Competitor Analysis #Diagram
-
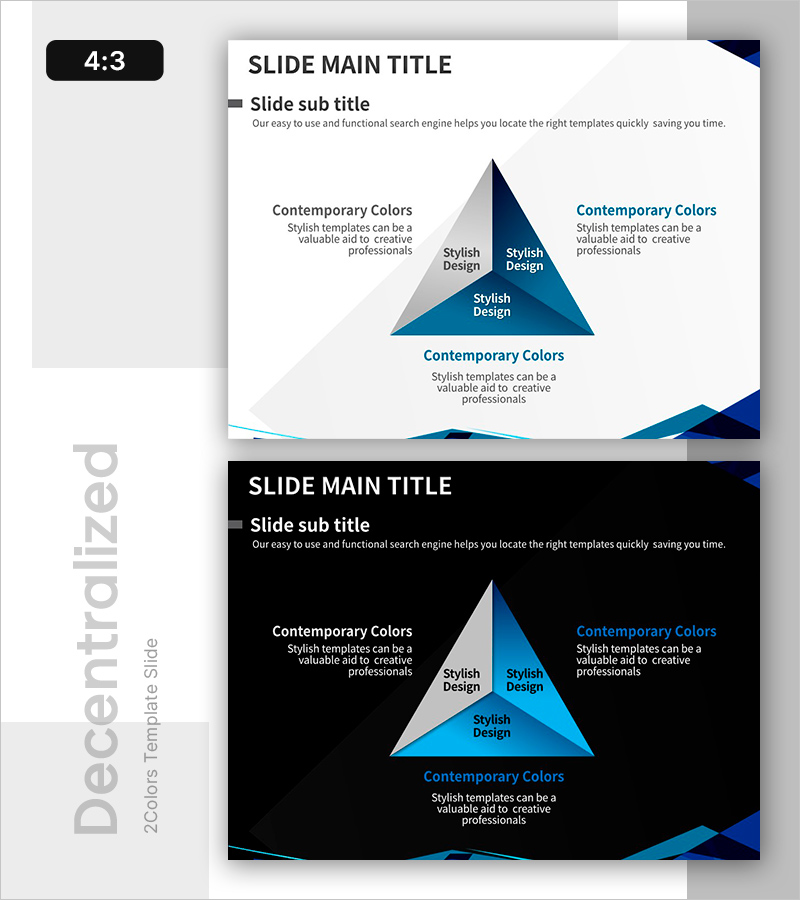
Defining Strategic Focus Directions – Solutions for Success
#Product/Service #Operation Plan #Diagram
-
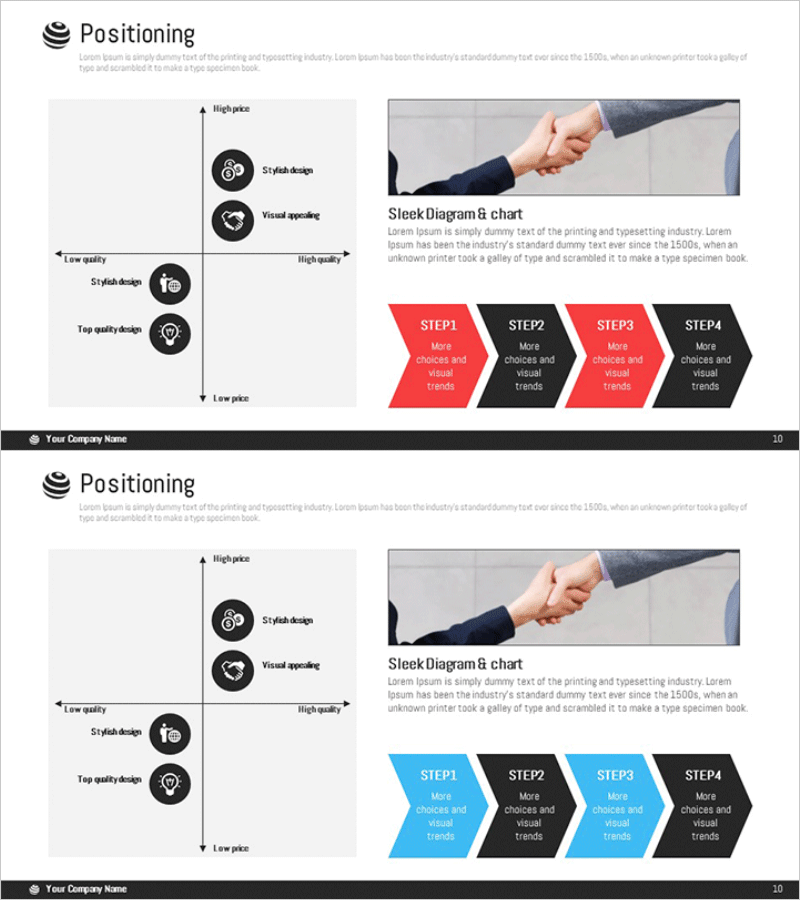
Competitive Market Positioning Analysis Chart - Essential for Marketing Strategy
#Marketing Plan and Strategy #Diagram #Graph
