Financial Plans and Performance
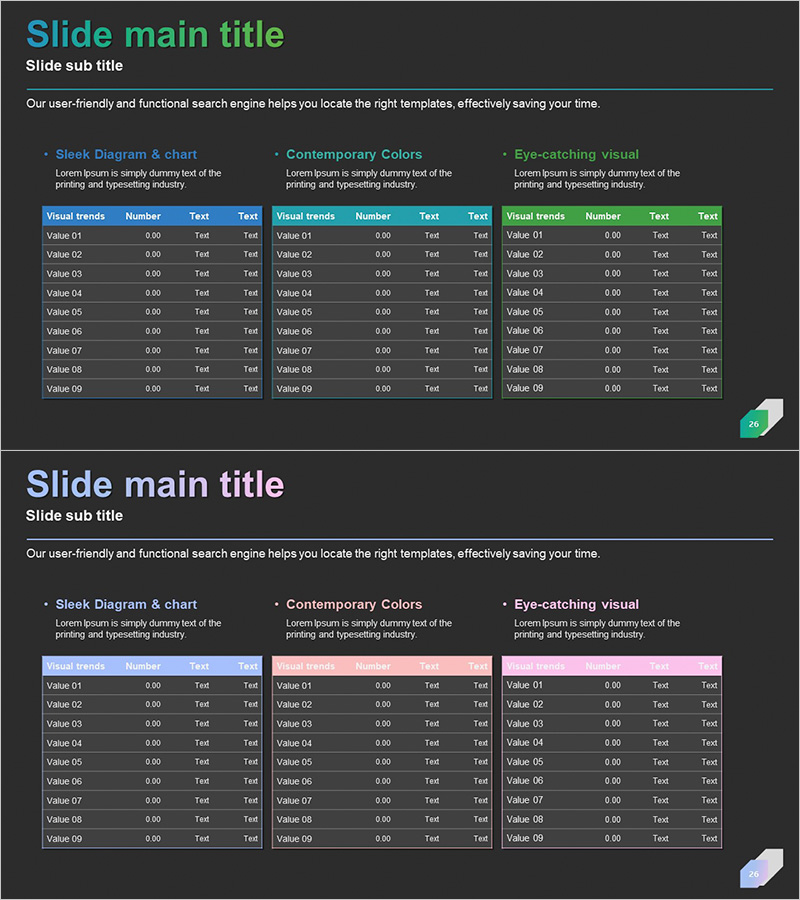
Income Statement Table for Visualizing Financial Performance - Insights Navigator
RJ0300060_25
- Last Update 12/21/2025
- File Size 0.1MB
- # of Slides 2
- File Format PPTX
- Slide Ratio 16:9
- Color
Keywords
About the Product
This slide visually represents financial performance based on an income statement in a table format. It features a contemporary and sleek table design, combining green and purple colors to convey stability and trust. The flowing layout adds clarity to the information being conveyed, allowing for easy comparison of various key financial metrics at a glance. It is ideal for financial planning and performance reports, making it suitable for internal reporting or investor presentations. The editable text and numerical fields allow for simple customization, with an editing difficulty rated as 'easy'.
Related Products
-
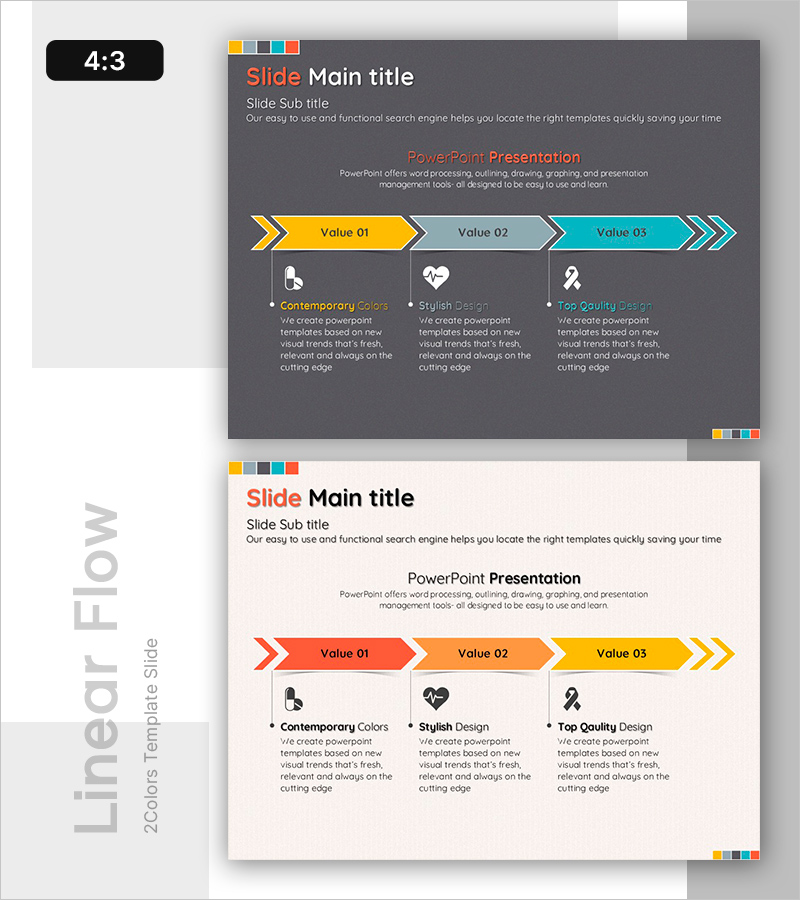
Step-by-Step Treatment Flowchart – Establishing Business Strategy
#Business Promotion Strategy #Operation Plan #Diagram
-
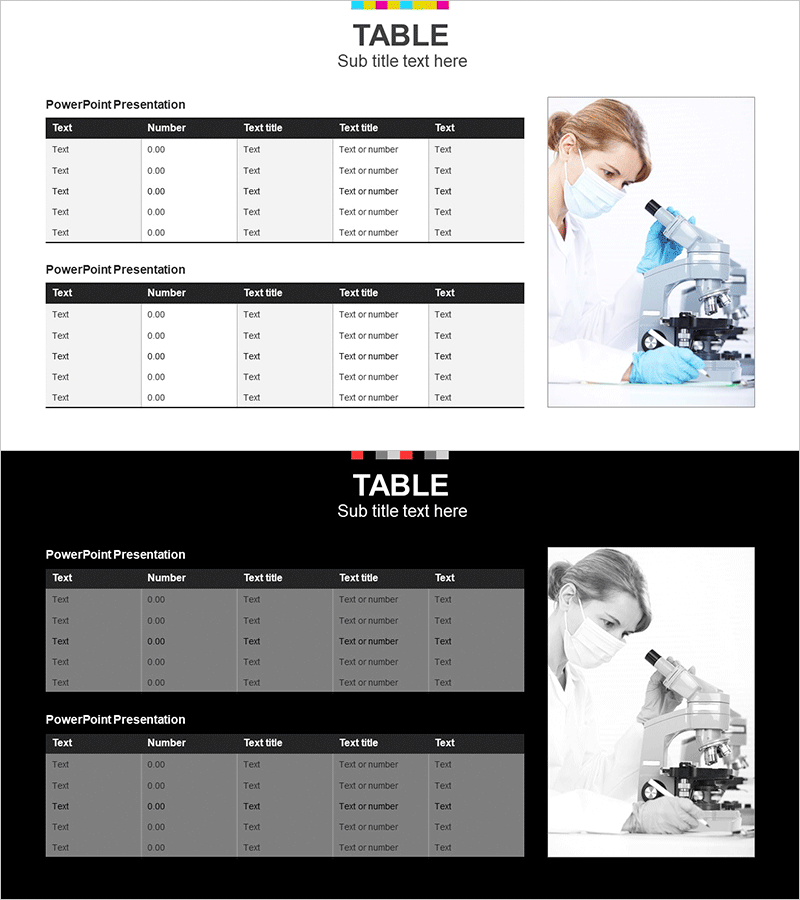
Experimental Results Analysis Table – Market and Competitive Analysis
#Market and Competitor Analysis #Diagram #Market Analysis
-
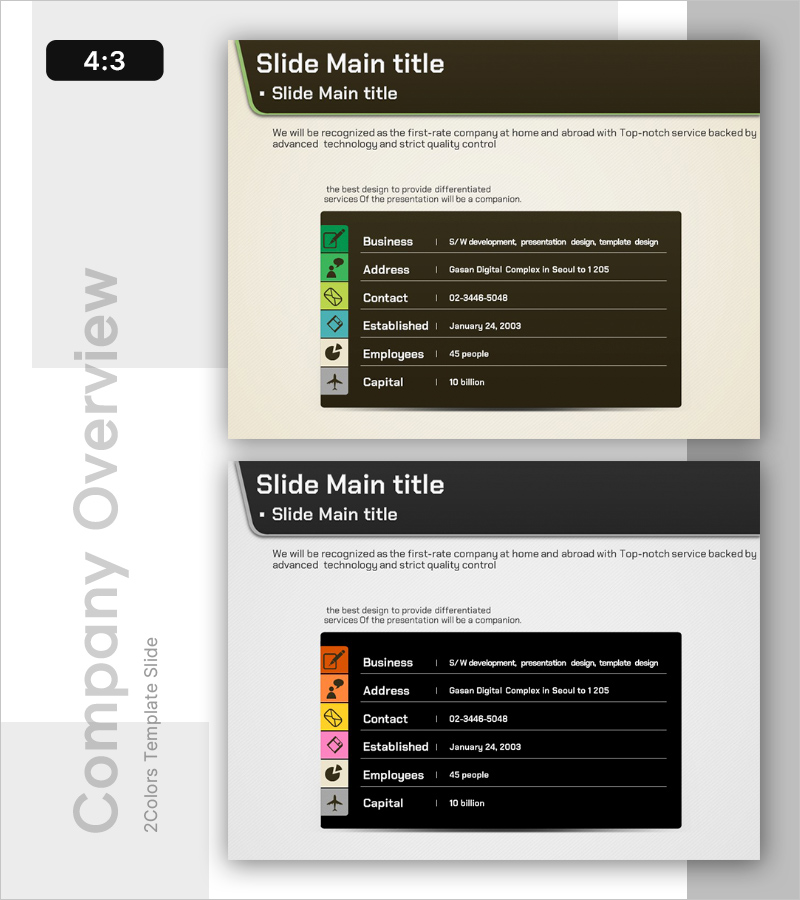
Silhouette PPT Company Overview – Cluster Format Information Visualization
#Company Introduction #Diagram #Text Box
-

Introduction to Club Members Slide – Stylish Design
#Company Introduction #Customer Success Stories #Diagram
