Product/Service
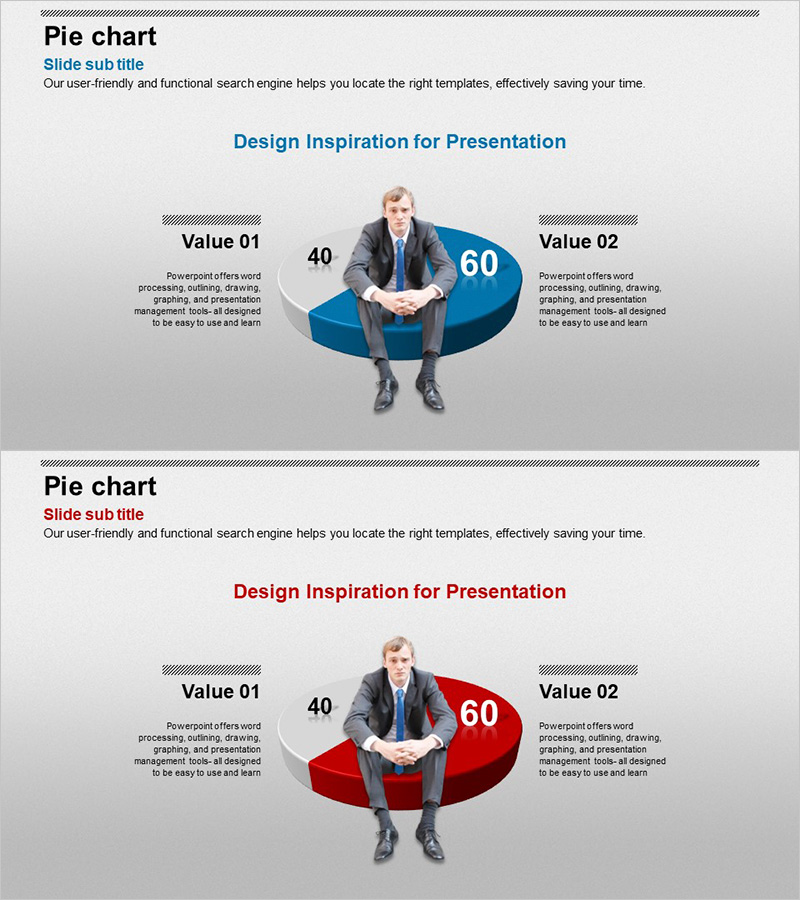
Business 3D Pie Chart – Optimized for Market and Competitor Analysis
RJ0300053_6
- Last Update 12/21/2025
- File Size 1.6MB
- # of Slides 2
- File Format PPTX
- Slide Ratio 16:9
- Color
Keywords
About the Product
This slide utilizes a 3D pie chart to effectively visualize market share of products or competitor analysis results. The harmonious color scheme of blue and red maximizes visual emphasis, while the centrally positioned circular graphic draws attention from the audience. Particularly suitable for presenting market and competitor analysis, it facilitates effective data communication in presentations or reports. Text and graphs are easily interchangeable, with an editing difficulty rated as 'easy', allowing for quick adoption in various business situations.
Related Products
-
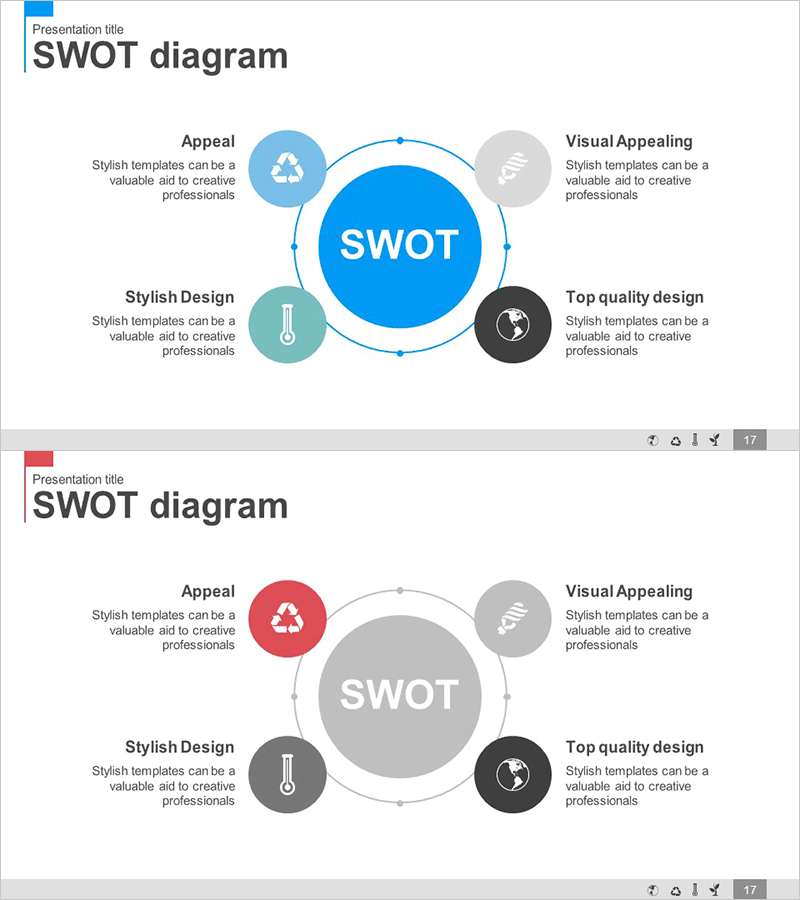
SWOT Analysis Diagram – Strategic Visualization for Global Environment
#Market and Competitor Analysis #Diagram #SWOT Analysis
-

Overview of Action-Oriented Business Programs - Effective Operational Plan Diagram
#Product/Service #Operation Plan #Diagram
-
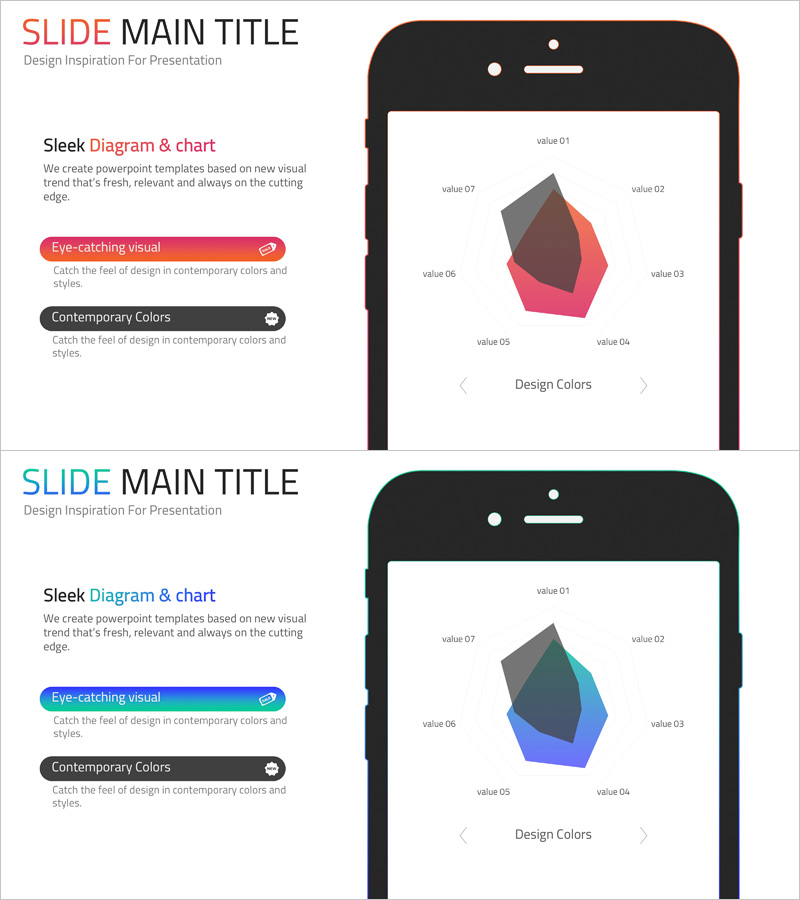
Online Shopping Mall System Radial Graph – Dynamic Data Visualization
#Business Introduction #Market and Competitor Analysis #Graph
-
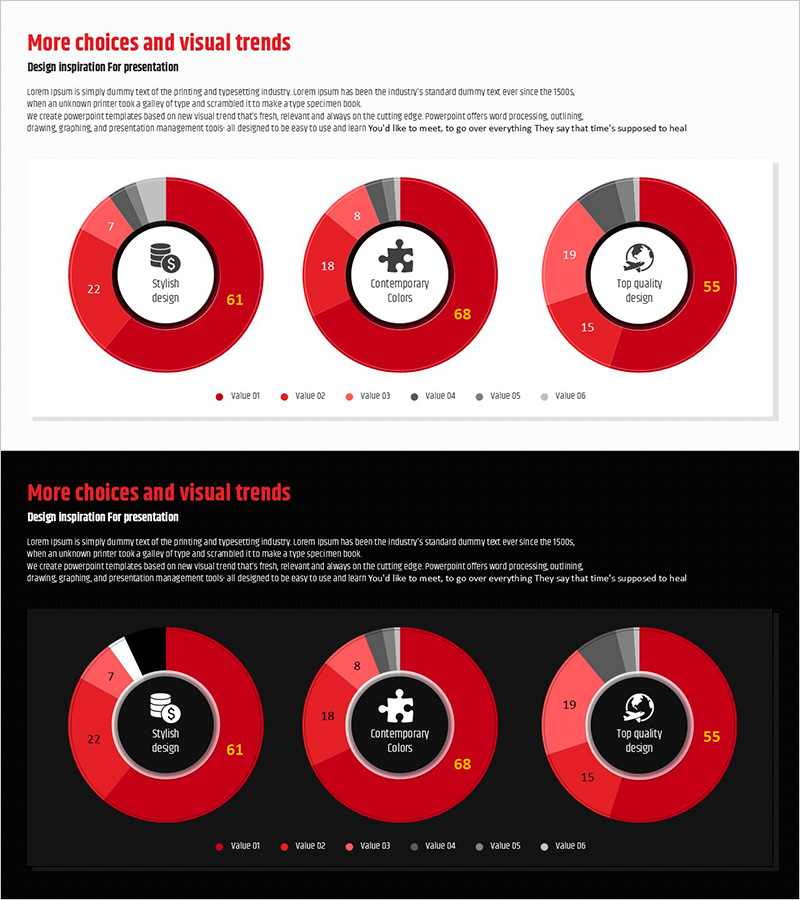
Red Market Share Slide – Compelling Donut Chart Design
#Market and Competitor Analysis #Graph #Market Share
