Product/Service
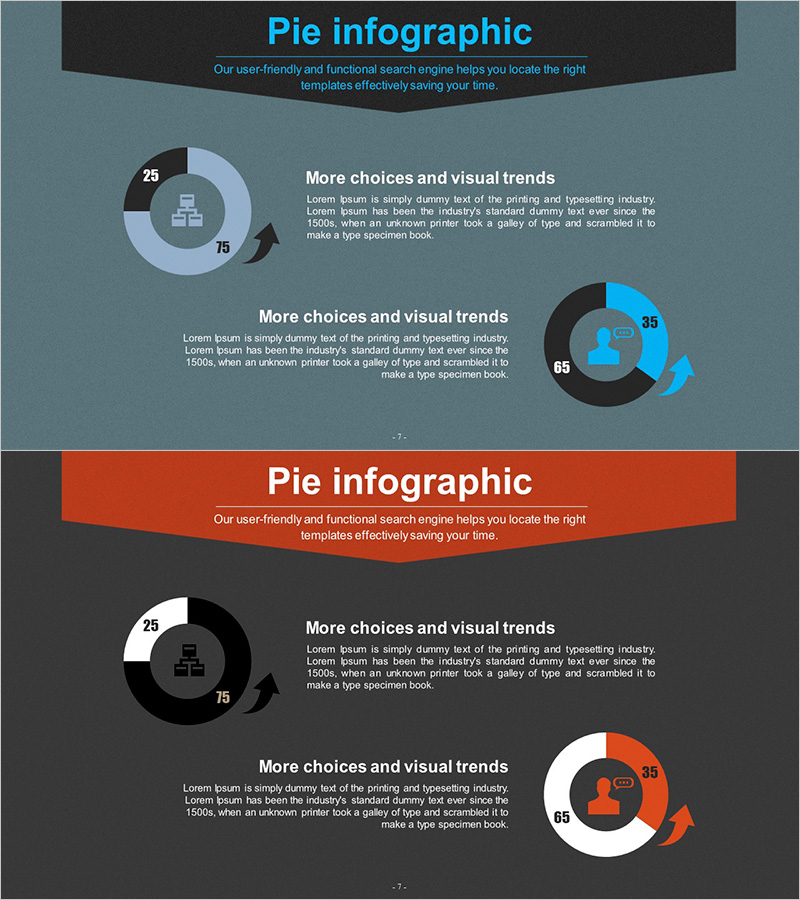
Visualizing Business Development Status with Donut Chart Slide
RJ0300052_6
- Last Update 12/21/2025
- File Size 4.4MB
- # of Slides 2
- File Format PPTX
- Slide Ratio 16:9
- Color
Keywords
About the Product
This slide utilizes a donut chart to visually represent the status of business development. It concisely conveys the proportions of each component, making it effective for presenting the technical status and business introduction. The combination of blue and red colors gives it a simple and modern look, easily capturing the audience's attention. This slide is particularly useful for illustrating development status, making it highly applicable in corporate presentations or reports. With an easy-to-edit structure, text and data can be modified effortlessly, rated as 'easy' in editing difficulty.
Related Products
-
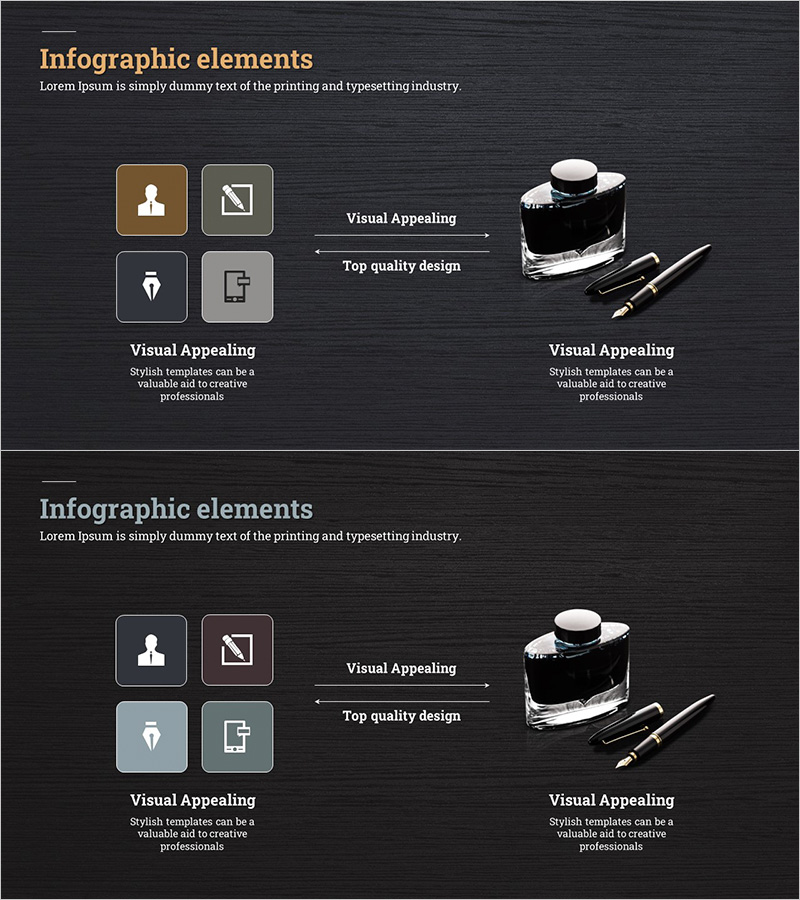
Fountain Pen Ink Marketing Strategy Slide
#Product/Service #Marketing Plan and Strategy #Diagram
-
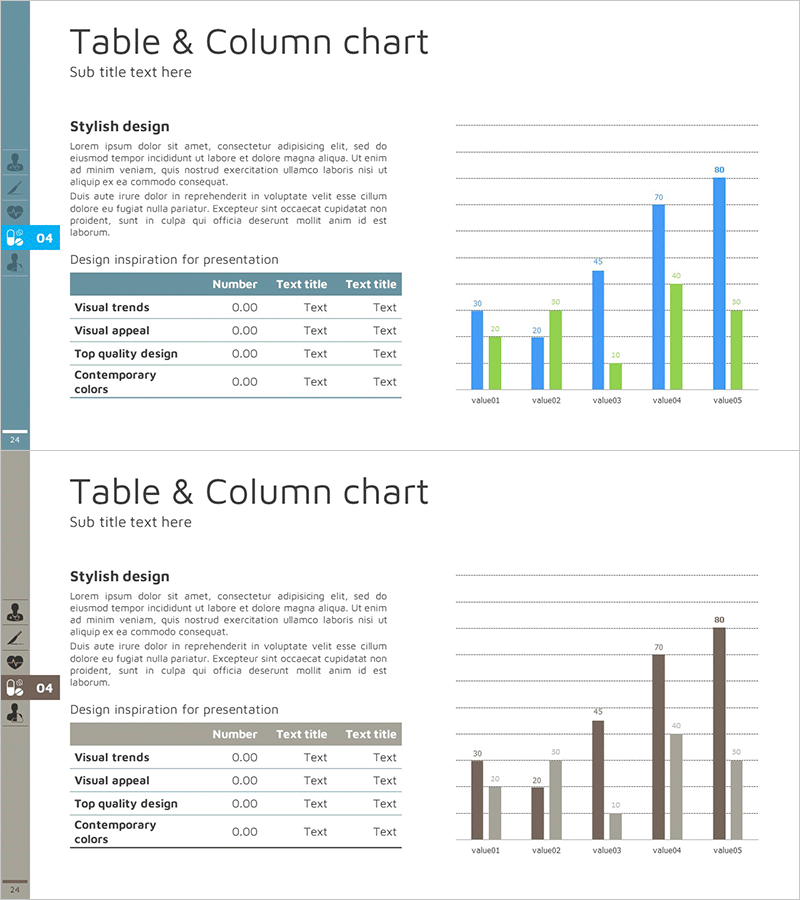
Table Chart & Clustered Column Graph – Market and Competitor Analysis
#Market and Competitor Analysis #Diagram #Graph
-
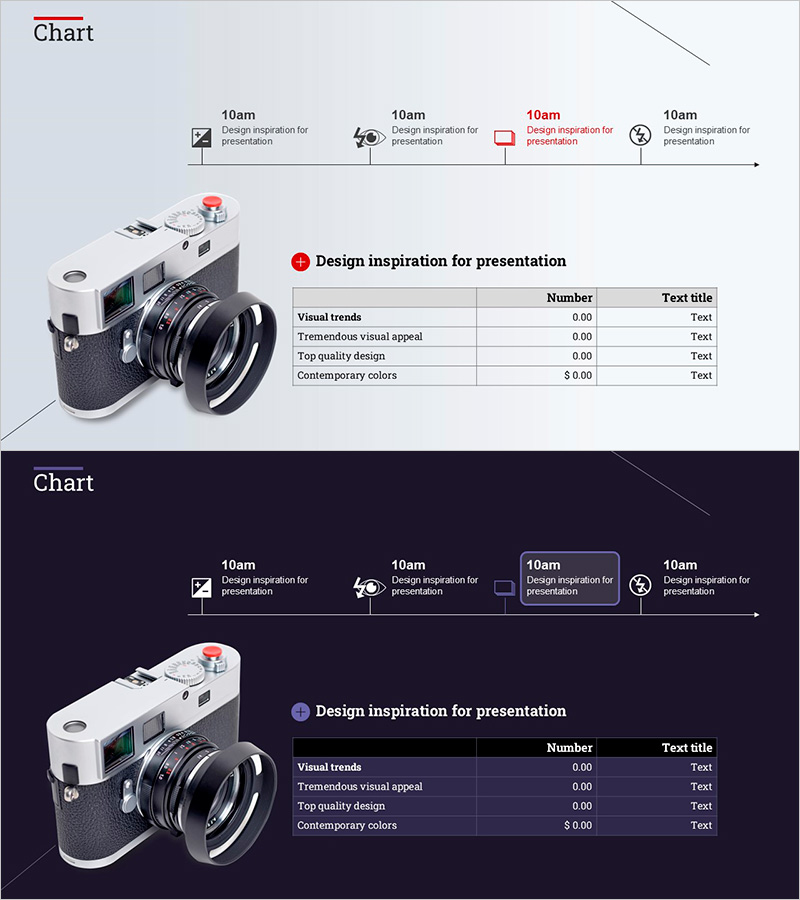
Camera System and Table Slide - Modern Design and Visual Appeal
#Product/Service #Diagram #Other
-

Trends in the Number of Professional Tennis Spectators – Performance and Competitive Advantage
#Business Promotion Strategy #Market and Competitor Analysis #Graph
