Market and Competitor Analysis
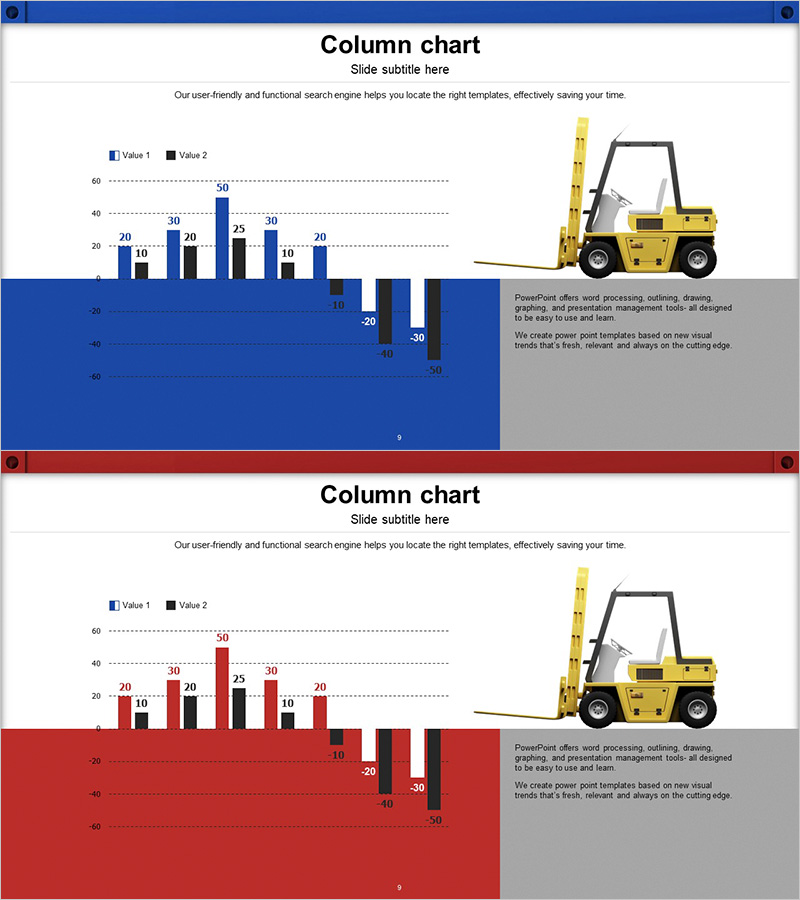
Logistics Performance Comparison Chart – Market and Competitor Analysis
RJ0300043_8
- Last Update 12/21/2025
- File Size 3.3MB
- # of Slides 2
- File Format PPTX
- Slide Ratio 16:9
- Color
Keywords
About the Product
This slide employs horizontal and vertical bar graphs to effectively compare logistics performance. Utilizing a grouped chart format allows for intuitive communication of diverse performance metrics. The contrasting colors of blue and red increase visual clarity and are useful for market and competitor analyses, making it ideal for business practitioners or analysts focused on logistics. Editing is simple, allowing for quick integration of data into various presentations.
Related Products
-
A Step-by-Step Plan for Summer Travel – Planning and Execution
#Business Promotion Strategy #Technology Sector #Diagram
-
User Analysis Graph by Age Group – Advanced Data Insights
#Market and Competitor Analysis #Diagram #Graph
-

Medical Industry Competitor Analysis Vertical Bar Graph
#Market and Competitor Analysis #Graph #Competitor Analysis
-
Radial Charts in the Architectural Sector - Innovative Customer Analysis
#Market and Competitor Analysis #Graph #Customer Analysis
