Business Sector Structure Diagram – Effective Organization Visualization
RJ0300030_15
- Last Update 04/26/2025
- File Size 1MB
- # of Slides 2
- File Format PPTX
- Slide Ratio 16:9
- Color
Keywords
- #Content-Based Slides
- #Design-Based Slides
- #Company Introduction
- #Diagram
- #Business Areas
- #Organizational Chart
- #Structure
- #Cluster
- #Tree Diagram
- #Chain Diagram
- #16:9
- #tree structure diagram PowerPoint
- #organization chart slide template
- #hierarchical structure diagram
- #business sector organization PowerPoint
- #3-level organizational chart slide
About the Product
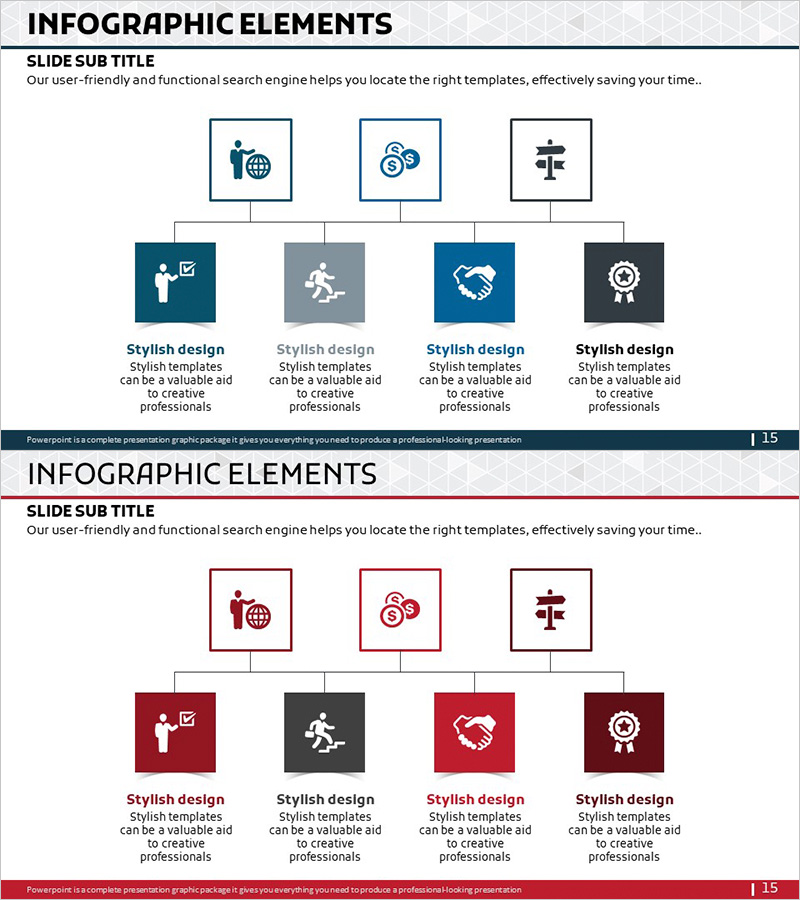
A tree structure diagram PowerPoint slide that clearly visualizes organizational hierarchy and business sector divisions. The slide features a central icon node at the top branching into three levels, with icon and text areas at each node. The navy, gray, and dark tone color scheme emphasizes professionalism and works seamlessly for organizational charts, departmental structures, and business sector classifications. The 2-slide set includes the same layout in two color variations (navy tone and wine tone), making it ideal for maintaining consistent visual branding throughout your presentation.
Usage Points
-
Main Usage
Used to visually organize and communicate organizational hierarchies, departmental systems, and business sector classifications. The top-down branching structure from a central node through three levels clearly expresses decision-making flows, responsibility frameworks, and classification systems.
-
How to Use
Apply this slide in company profile presentations, organizational restructuring announcements, or business strategy explanations when illustrating organizational structure or business sector composition. Enter department names, titles, or sector names in each node's text area, and customize icons as needed to match your content.
-
Recommended For
Recommended for HR professionals, executives, and business development teams explaining organizational structure; marketing teams organizing business sector portfolios; and project managers visualizing departmental roles and responsibilities. Particularly suited for formal presentations requiring clear hierarchical relationships.
-
Slide Structure
2-slide set. Each slide features a central icon node at the top, three icon nodes in the middle tier (level 1), and four icon nodes in the bottom tier (level 2), connected by lines showing hierarchical relationships. Slide 1 uses navy and gray tones; Slide 2 provides a wine and dark tone color variation.
Related Products
-

Bank Service Company Organization Chart – Modern and Sleek Structure
#Company Introduction #Diagram #Organizational Chart
-

Business Relationship Diagram for Organizational Visualization – Effective System Structuring
#Company Introduction #Technical Approach #Diagram
-

Medical Business Organization Chart Diagram - Clarifying Business Structure
#Company Introduction #Diagram #Business Areas
-

Business Area Organization Chart Diagram – Systematic Structure
#Company Introduction #Diagram #Business Areas
