Business Services Overview – Efficient Solutions Through Data
RJ0300021_6
- Last Update 04/23/2025
- File Size 5.6MB
- # of Slides 2
- File Format PPTX
- Slide Ratio 16:9
- Color
Keywords
- #Content-Based Slides
- #Design-Based Slides
- #Product/Service Introduction
- #Diagram
- #Product and Service Overview
- #Cluster
- #Closed Cluster Diagram
- #16:9
- #closed cluster diagram PowerPoint
- #circular structure slide template
- #business infographic PPT
- #data visualization presentation
- #how to create cluster diagram in PowerPoint
About the Product
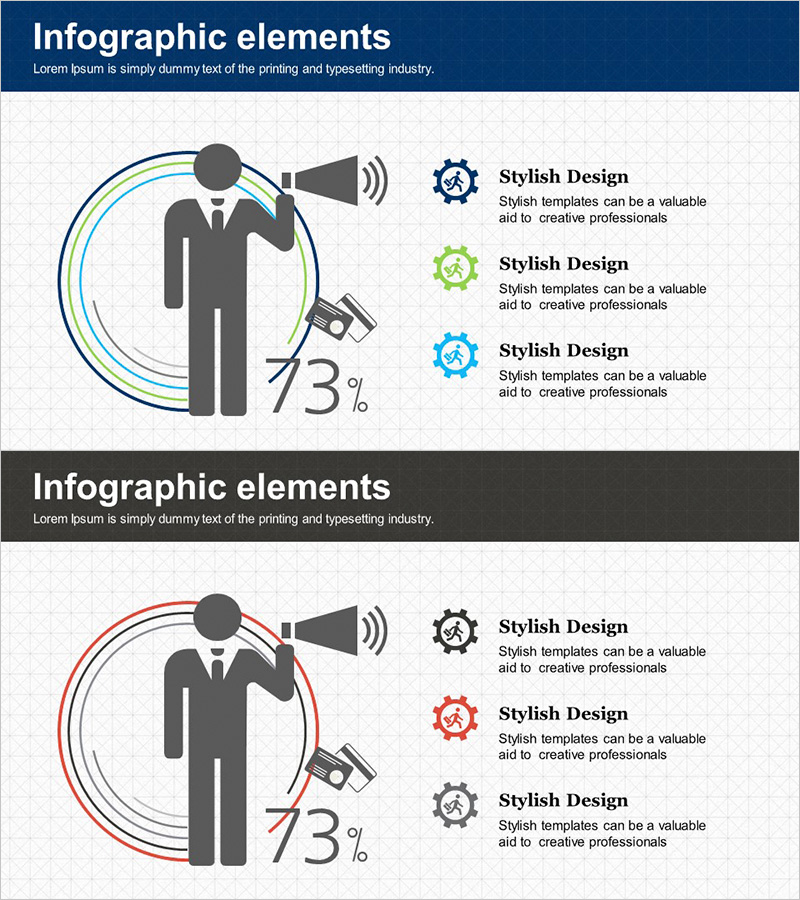
A closed cluster diagram PowerPoint slide that visualizes business services overview with a circular structure. The design features a central human silhouette surrounded by concentric circular lines, with three gear icons and text areas positioned symmetrically. Three accent colors—navy blue, lime green, and sky blue—distinguish each item, while a data percentage (73%) is prominently displayed. Two color variations (navy background and dark background) are included, allowing you to match your presentation tone. Fully editable PPTX format with 16:9 aspect ratio and 2 slides.
Usage Points
-
Main Usage
Ideal for explaining three core elements of a business service or solution connected to a central concept in an integrated manner. The circular closed structure visually communicates cyclical relationships, interconnectedness, and a complete system. Data percentage display emphasizes efficiency and performance outcomes.
-
How to Use
Use in company overview, proposal, or business plan presentations to organize three key features, values, or benefits. Edit text and icons for each item, and adjust colors to match your brand identity. Replace the data percentage with actual performance metrics or efficiency indicators to strengthen credibility.
-
Recommended For
Business strategy, marketing, and operations professionals presenting service structures, processes, or efficiency improvements. Suitable for IT, consulting, and financial services solution proposals. Effective for executive and client presentations where complex concepts need clear, visual communication.
-
Slide Structure
Central human silhouette surrounded by concentric circular lines in navy blue, lime green, and sky blue. Three gear icons positioned symmetrically (top-right, bottom-right, left) with adjacent text input areas. Data percentage display (73%) in bottom-left corner. Two color variations provided: navy background and dark background.
Related Products
-

Engaging Product Introduction Slide with Hamburger Image and Icons
#Slide Type #Product/Service Introduction #Diagram
-

Aerospace Industry Introduction Diagram – Visualizing Cluster Information
#Product/Service Introduction #Diagram #Program Introduction
-

Sea Closed Diffusion Diagram – Business Vision and Strategy
#Product/Service Introduction #Business Vision and Strategy #Diagram
-

Korean Fermentation Culture Slide Template Introduction
#Slide Type #Product/Service Introduction #Diagram
