Cluster Diagram Explaining Differentiated Business Objectives
RJ0300021_12
- Last Update 04/23/2025
- File Size 5.6MB
- # of Slides 2
- File Format PPTX
- Slide Ratio 16:9
- Color
Keywords
- #Content-Based Slides
- #Design-Based Slides
- #Business Vision and Strategy
- #Marketing Plan and Strategy
- #Diagram
- #Core Competencies
- #Marketing Objectives
- #Cluster
- #Chain Diagram
- #16:9
- #cluster diagram PowerPoint
- #overlapping circle diagram presentation
- #business objective comparison slide
- #two-circle Venn diagram PPT
- #strategy comparison template
About the Product
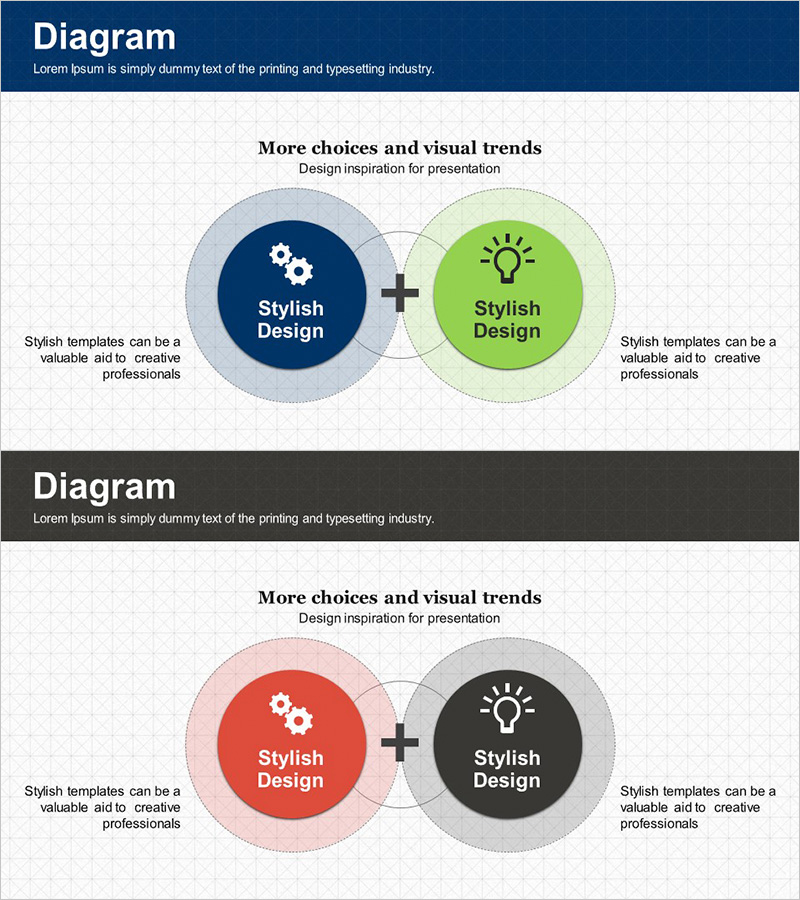
A cluster diagram PowerPoint slide featuring two overlapping circular nodes that emphasize the intersection area for comparing differentiated business objectives or strategies. The dark blue and lime green color combination creates strong visual contrast, with icons and text positioned inside each circle to clearly express relationships and commonalities between concepts. Formatted in 16:9 widescreen ratio with 2 slides, this presentation slide deck is ready for immediate use and allows flexible editing of colors and text content.
Usage Points
-
Main Usage
This diagram is designed to express differences and commonalities between two business objectives, strategies, products, or services simultaneously. The overlapping circular node structure clearly visualizes each item's independent characteristics and the shared value in the intersection area, making it highly effective for strategic decision-making and business planning presentations.
-
How to Use
Use this slide in business strategy presentations, marketing planning documents, product comparison analyses, and organizational goal-setting slides when contrasting or integrating two concepts. Simply replace the text and icons within each circle with specific objective names, characteristics, and core values relevant to your presentation.
-
Recommended For
Ideal for executives, marketing professionals, strategic planning teams, consultants, and educators explaining business objective comparisons, competitive analysis, organizational integration, and product positioning. Particularly effective when clearly distinguishing advantages and disadvantages between two options while highlighting synergy areas.
-
Slide Structure
Two-slide composition with each slide divided into a dark blue header area and white content area. The main diagram features two overlapping circular nodes (dark blue and lime green) centered on the slide, with gear and lightbulb icons and 'Stylish Design' text positioned inside each circle. Text explanation areas on both left and right sides allow for adding detailed information about each objective.
Related Products
-

Vision and Key Message Diagram – Business Vision and Strategy
#Business Vision and Strategy #Marketing Plan and Strategy #Diagram
-

Setting Core Marketing Goals – Business Strategy Diagram
#Business Vision and Strategy #Marketing Plan and Strategy #Diagram
-

Simple PowerPoint Wide Template Connection Diagram
#Business Introduction #Business Vision and Strategy #Diagram
-

Marketing Goals Puzzle Shape Diagram – Effective Business Strategy Visualization
#Business Vision and Strategy #Marketing Plan and Strategy #Diagram
