Visualizing Financial Growth Drivers and Key Factors with a Cluster Diagram
RB0800041-1_8
- Last Update 03/25/2025
- File Size 2.1MB
- # of Slides 2
- File Format PPTX
- Slide Ratio 4:3
- Color
Keywords
- #Content-Based Slides
- #Design-Based Slides
- #Business Vision and Strategy
- #Marketing Plan and Strategy
- #Diagram
- #Core Competencies
- #Pricing Strategy
- #Cluster
- #Spread
- #Chain Diagram
- #Centralized Diagram
- #4:3
- #radial diagram PowerPoint slide
- #8-segment circular chart
- #financial growth visualization
- #business strategy diagram
- #hub-and-spoke PowerPoint template
About the Product
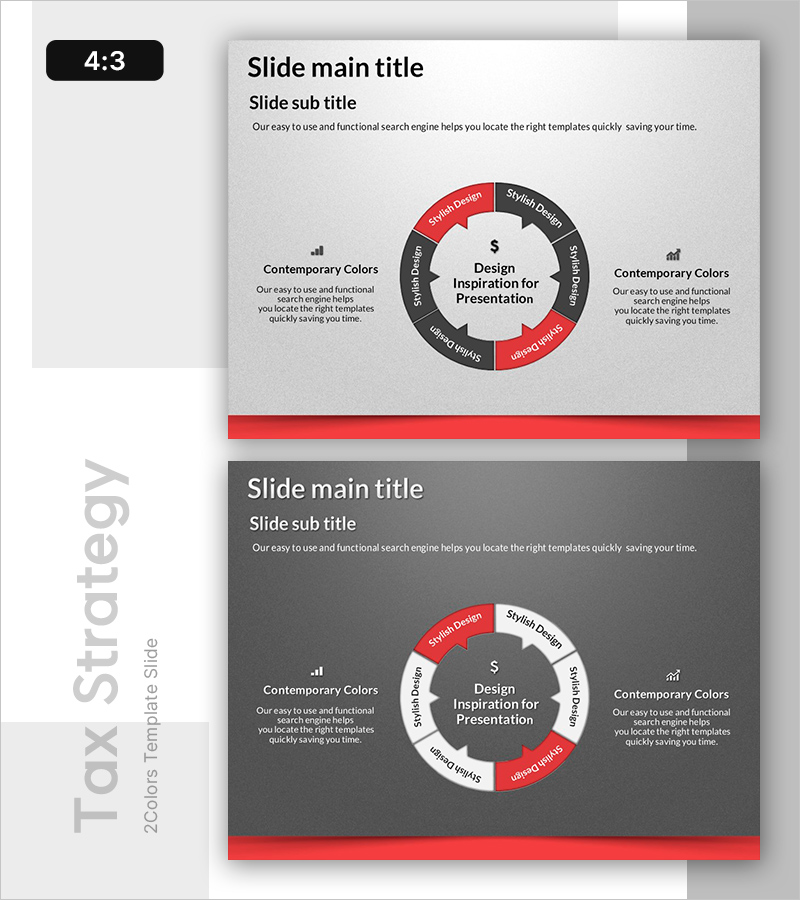
A 2-slide PowerPoint presentation featuring an 8-segment radial diagram centered on core business concepts. The design uses a central circular hub labeled 'Design Inspiration for Presentation' with eight sectors radiating outward, each containing text fields for key elements. The color scheme combines red and charcoal gray to highlight priority areas, with supporting text boxes labeled 'Contemporary Colors' positioned on both sides. This structure is ideal for business presentations, strategy decks, and financial reports requiring multi-element visualization around a central theme.
Usage Points
-
Main Usage
Visualize organizational core values, business strategy pillars, or financial growth drivers by placing a central concept with eight supporting elements radiating outward. The hub-and-spoke structure emphasizes the relationship between a central theme and multiple contributing factors.
-
How to Use
Enter your core message or concept in the central circular area. Populate each of the eight sectors with supporting elements, strategies, or key factors. Use the red-highlighted sectors for priority items and gray sectors for secondary information to create visual hierarchy.
-
Recommended For
Financial institutions, investment presentations, corporate strategy meetings, marketing planning sessions, executive briefings, and business consulting reports. Particularly effective when presenting multi-faceted approaches to a central business objective or organizational vision.
-
Slide Structure
Two-slide set: Slide 1 features a light background with the 8-segment radial diagram, central white hub, and side text areas. Slide 2 presents the same layout on a dark gray background. Both slides are fully editable in 4:3 aspect ratio PPTX format.
Related Products
-

Flower-shaped Connecting Diagram – Business Vision and Strategy
#Business Introduction #Business Vision and Strategy #Diagram
-

Gardening Diagram – Business Introduction and Strategy
#Business Introduction #Business Vision and Strategy #Diagram
-

Survival Swimming Diagram – Risk Management and Cluster Strategy
#Business Vision and Strategy #Risk Management and Regulatory Compliance #Diagram
-

Game Strategy Visualization Diagram Slide – Emphasizing Core Competencies
#Business Vision and Strategy #Technical Approach #Diagram
