Green Table Diagram – 2 Versions of Design
RJ0300020_9
- Last Update 04/23/2025
- File Size 1.2MB
- # of Slides 2
- File Format PPTX
- Slide Ratio 16:9
- Color
Keywords
About the Product
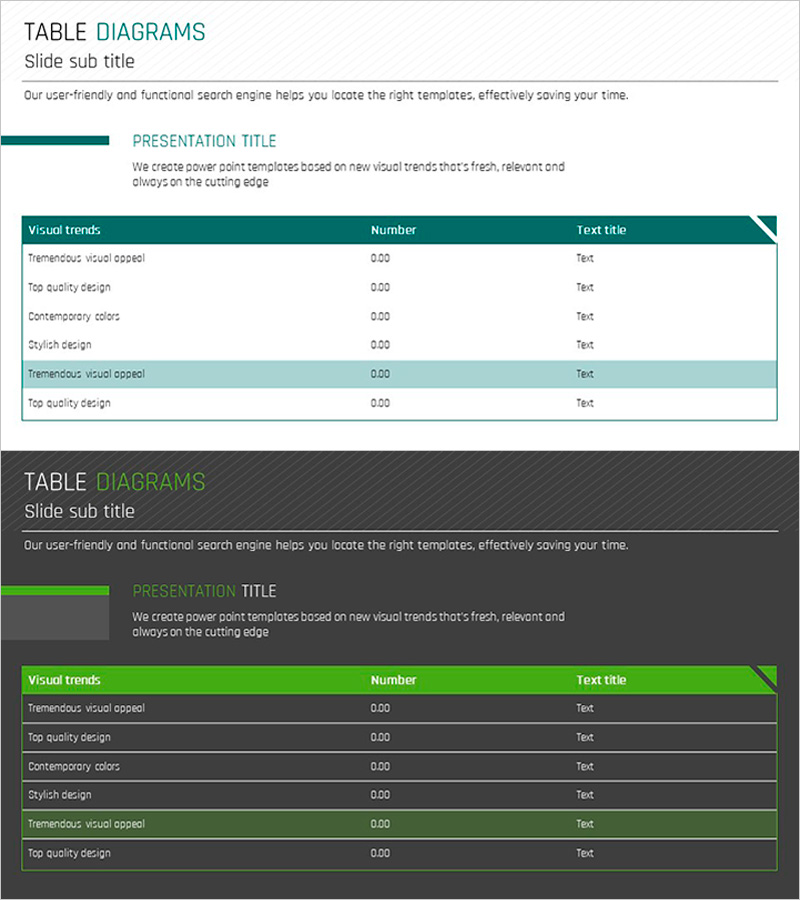
A professional table diagram PowerPoint slide designed to organize and compare business data clearly. This template offers 2 design versions with green headers and light teal accent rows for visual hierarchy. The first version features a white background with green header and six editable text columns, while the second version uses a dark gray background with bright green headers for enhanced contrast. Each slide is optimized for presenting quantitative data, performance metrics, market analysis, and competitive comparisons. Available in 16:9 widescreen PPTX format, fully editable and ready to integrate into presentations and business slides.
Usage Points
-
Main Usage
This slide presents quantitative data and categorical information in a clear table format for comparison and analysis. Ideal for performance metrics, market analysis, competitive benchmarking, product specifications, and financial summaries. The green header conveys trust and growth, while two background options allow customization to match your presentation tone.
-
How to Use
Simply enter your data into the editable text fields in each cell. The first version with white background works well for printed materials and online presentations, while the dark gray version is effective for projector-based meetings and in-person conferences. Colors and fonts can be freely adjusted to match your corporate branding guidelines.
-
Recommended For
Recommended for executive reports, business plans, marketing proposals, investor pitch decks, quarterly performance reviews, market research reports, and financial summaries. Ideal for planners, analysts, marketers, financial professionals, and business managers presenting data-driven insights.
-
Slide Structure
Two-slide set, each featuring a 3-row (1 header + 2 data rows) × 6-column table layout. The header row is unified in green, with one data row highlighted in light teal for visual emphasis and hierarchy. All cells are fully editable for text input. Optimized in 16:9 widescreen format for modern projectors and digital displays.
Related Products
-

Business Overview Diagram – Effective Cluster Design for Business Introduction
#Company Introduction #Business Introduction #Business Vision and Strategy
-

Sales & Investment Plan Slide Template
#Operational Plan #Financial Plans and Performance #Diagram
-

Dynamic Triangle Pattern Inclusion Diagram – Business Vision and Strategy
#Business Vision and Strategy #Business Management #Diagram
-

A Glimpse of Campus Life – Cluster Diagram
#Slide Type #Product/Service Introduction #Diagram
