Flow Diagram of Arrow Layered Structure – Business Strategy
RJ0300020_7
- Last Update 04/23/2025
- File Size 1.2MB
- # of Slides 2
- File Format PPTX
- Slide Ratio 16:9
- Color
Keywords
- #Content-Based Slides
- #Design-Based Slides
- #Business Strategy
- #Operational Plan
- #Diagram
- #Business Direction
- #Business Processes
- #Structure
- #Cluster
- #Pyramid Chart
- #Closed Cluster Diagram
- #16:9
- #arrow diagram PowerPoint
- #3-step flow chart slide
- #business strategy presentation
- #hierarchical structure diagram
- #process flow PPT slide
About the Product
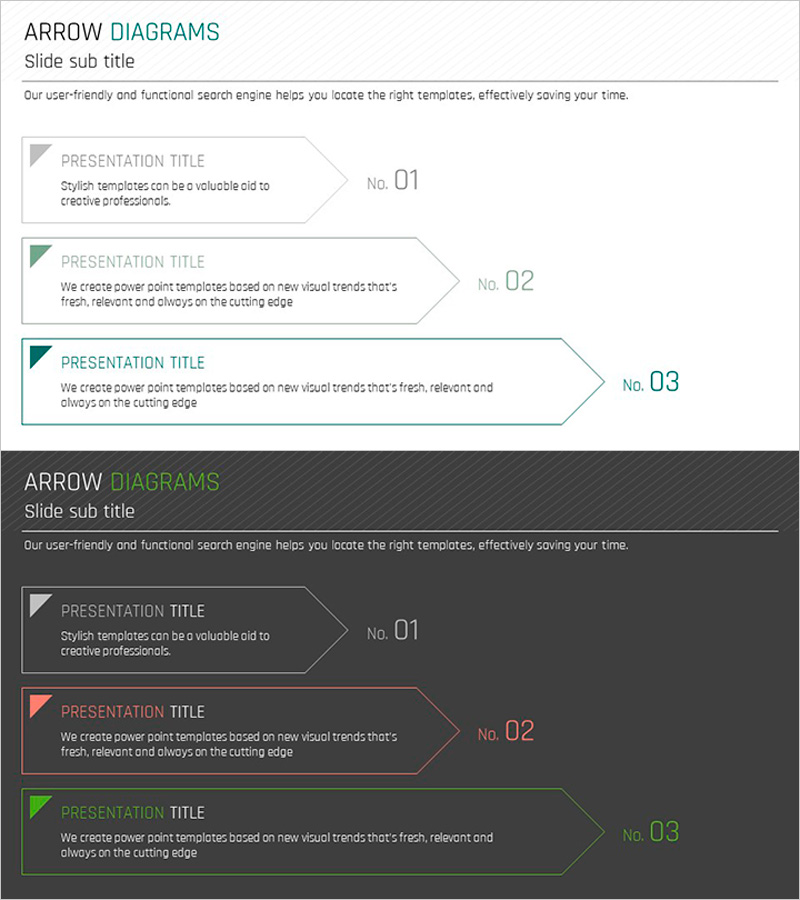
A 3-step arrow flow diagram PowerPoint slide that visualizes business strategy progression with sequential stages. The design features left-aligned triangle icons and right-pointing arrow shapes in a hierarchical structure, clearly expressing step-by-step processes. Color-coded stages in green, navy, and gray tones on a light background, with a dark background version also included. This PPT diagram effectively communicates multi-stage processes such as strategy planning, execution phases, and performance measurement in presentations and business proposals.
Usage Points
-
Main Usage
Optimized for visually expressing 3-stage business strategy processes. Arrow-shaped stages clearly distinguish strategy planning → execution → performance measurement, enhancing audience comprehension and engagement.
-
How to Use
Apply to strategy sections in business plans, proposals, and strategic presentations. Input stage-specific text and adjust colors to match organizational branding. Available in both light and dark background versions for flexible slide design integration.
-
Recommended For
Ideal for executives, planning teams, marketing departments, and project managers explaining strategy development and implementation plans. Effective for reporting new business initiatives, organizational restructuring, marketing campaigns, and product development roadmaps.
-
Slide Structure
2-slide set featuring light and dark background versions. Each slide contains a 3-step hierarchical structure with left-aligned triangle icons and right-pointing arrows, color-coded in green, navy, and gray tones for stage differentiation.
Related Products
-

Three-Step Layered Learning Plan Diagram – Cluster for Business Strategy Implementation
#Business Strategy #Business Management #Diagram
-

Flowchart of the Construction Propulsion System
#Business Strategy #Operational Plan #Diagram
-

Slide Template Featuring Children Images and Step Elements
#Business Strategy #Operational Plan #Diagram
-

Natural Environment Icon and Pyramid Structure Slide
#Product/Service Introduction #Diagram #Features
