Building Process List Slide Template – Innovative Visualization
RJ0300020_12
- Last Update 04/23/2025
- File Size 7MB
- # of Slides 2
- File Format PPTX
- Slide Ratio 16:9
- Color
Keywords
- #Content-Based Slides
- #Design-Based Slides
- #Technical Approach
- #Diagram
- #Service Operation Plan
- #Innovative Technologies and Future Plans
- #Cluster
- #Closed Cluster Diagram
- #16:9
- #building process diagram PowerPoint
- #cluster diagram slide
- #3-stage process visualization
- #construction project presentation
- #process flow PowerPoint template
About the Product
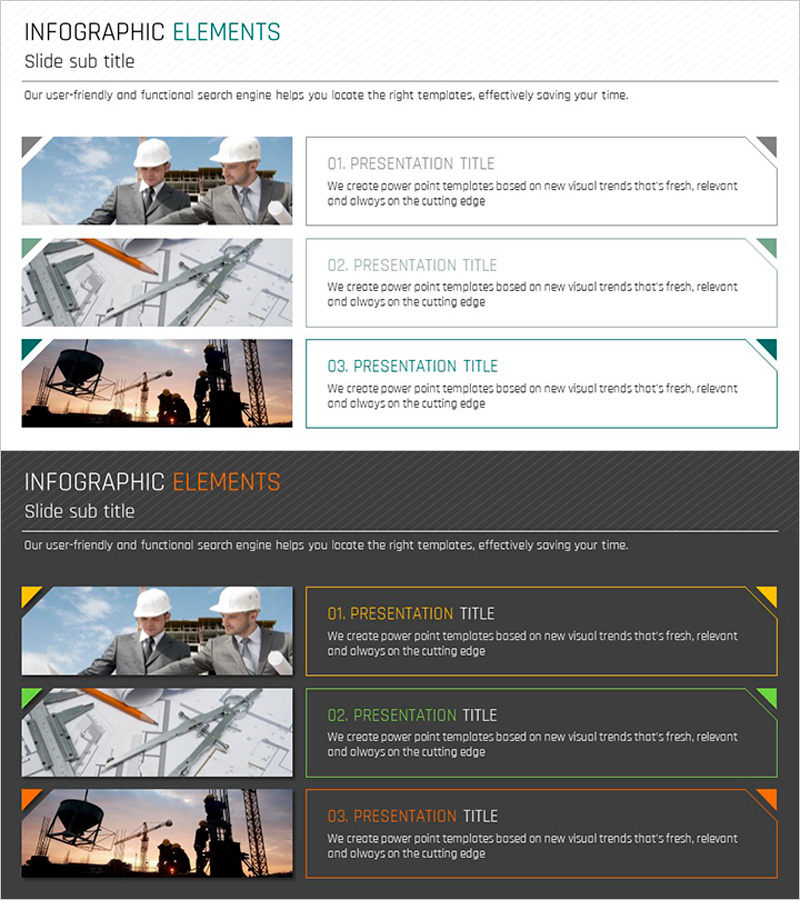
A three-stage cluster diagram PowerPoint slide that visualizes the sequential phases of construction and building projects. This slide combines a left-side image area with right-side text boxes to clearly communicate each project phase. Color-coded elements in blue, green, and orange distinguish each stage, while triangular corner accents add visual emphasis. The layout is ideal for presenting construction processes, service implementation plans, and project phase explanations. This ready-to-use PowerPoint slide works seamlessly in presentations, proposals, and progress reports.
Usage Points
-
Main Usage
Systematically explain the sequential phases of construction and building projects while visually representing the role and relationship of each stage. The combination of images and text boxes enhances information delivery, while color coding ensures clear stage differentiation and professional presentation impact.
-
How to Use
Place construction site photos, blueprints, or completion images on the left side, then enter phase titles and descriptions in the right-side text boxes. Color codes can be retained or customized to match your company branding. The two-slide set allows flexible use for explaining project initiation, execution, and completion phases across different presentation contexts.
-
Recommended For
Ideal for construction and building company project proposals, construction manager progress reports, real estate developer business presentations, architect portfolio showcases, and construction industry training materials. Recommended for any presentation requiring clear process phase explanation and professional visual communication.
-
Slide Structure
Two-slide set with each slide divided into a left image area (approximately 40%) and right text box area (approximately 60%). The right side contains three phase-specific text boxes, each marked with blue, green, and orange triangular corner accents for clear stage differentiation. Optimized for 16:9 widescreen format with professional spacing and alignment.
Related Products
-

Strategy for Enhancing Reading Education for Children – Effective Cluster Diagram
#Operational Plan #Technical Approach #Diagram
-

Closed Diagram for Educational Analysis and Measures
#Operational Plan #Technical Approach #Diagram
-

System Operation Guidelines for Risk Management and Compliance PPT
#Technical Approach #Risk Management and Regulatory Compliance #Diagram
-

Cognitive Process Diagram – Cluster-Based Operational Plan
#Operational Plan #Technical Approach #Diagram
