Transportation Distribution Strategy – Diagram for Effective Marketing
RJ0300017_14
- Last Update 04/22/2025
- File Size 5.3MB
- # of Slides 2
- File Format PPTX
- Slide Ratio 16:9
- Color
Keywords
- #Content-Based Slides
- #Design-Based Slides
- #Marketing Plan and Strategy
- #Diagram
- #Distribution Strategy
- #Cluster
- #Combination Diagram
- #16:9
- #nested diagram PowerPoint
- #3-node relationship diagram
- #transportation distribution strategy slide
- #marketing diagram PPT
- #circular node diagram
- #distribution strategy presentation
About the Product
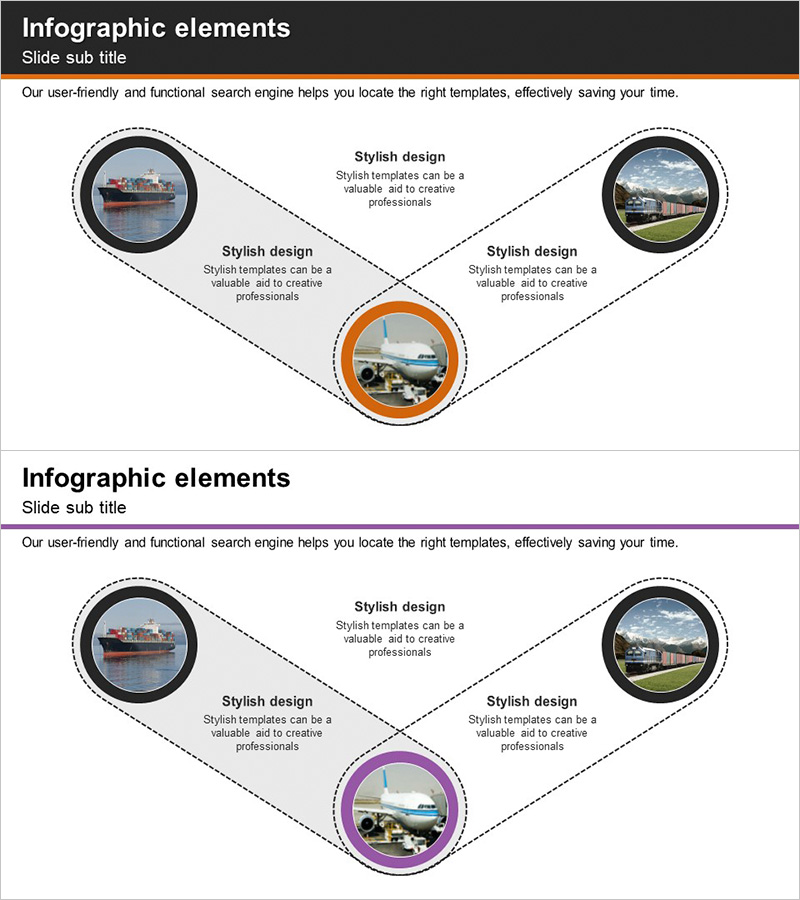
A 3-node nested diagram PowerPoint slide that visualizes transportation and distribution strategy relationships. The central node represents the core strategy, while upper-left and upper-right nodes connect as supporting elements, making it ideal for marketing planning and strategy presentations. Circular nodes accommodate image insertion, and the orange, purple, and black color combination creates strong visual emphasis. The 2-slide set is ready to use in business proposals, strategy decks, and marketing presentations.
Usage Points
-
Main Usage
Express the relationship between transportation mode selection, distribution channels, and marketing strategy using three interconnected nodes. The central node anchors the core strategy while upper-side nodes represent supporting elements, enabling clear visualization of complex business relationships.
-
How to Use
Insert relevant images or icons into each circular node and add strategy labels in text areas. Use in business plans, marketing proposals, and distribution strategy presentations to explain how key elements connect. Color accents emphasize priority and importance across the diagram.
-
Recommended For
Marketing managers, distribution strategists, business development teams, and executives preparing strategy reports. Ideal for transportation, logistics, and retail industries presenting strategy frameworks, consulting reports, and executive briefings.
-
Slide Structure
2-slide layout with each slide featuring one central circular node (orange or purple accent) and two upper-positioned circular nodes (black border). Dotted connector lines show relationships between nodes. Text description areas below each node allow input of strategy items and explanations.
Related Products
-

Visualizing Business Vision and Marketing Strategy with Curved Theme Diagram
#Business Vision and Strategy #Marketing Plan and Strategy #Diagram
-

Marketing and Distribution Strategy Presentation Template – Simple and Elegant Design
#Marketing Plan and Strategy #Diagram #Distribution Strategy
-

Overlapping Diagram and Target Market Location – Visualizing Marketing Strategy
#Marketing Plan and Strategy #Diagram #Other
-

Opportunity Analysis Diagram Slide
#Market and Competitor Analysis #Diagram #SWOT Analysis
