Market Analysis with Golden Circle Diagram – Inclusive Cluster
RJ0300011_15
- Last Update 04/21/2025
- File Size 0.1MB
- # of Slides 2
- File Format PPTX
- Slide Ratio 16:9
- Color
Keywords
- #Content-Based Slides
- #Design-Based Slides
- #Market and Competitor Analysis
- #Diagram
- #Market Analysis
- #Cluster
- #Inclusive Cluster Diagram
- #16:9
- #concentric circle diagram PowerPoint
- #nested diagram slide template
- #4-layer cluster visualization
- #market analysis diagram
- #golden circle PPT slide download
About the Product
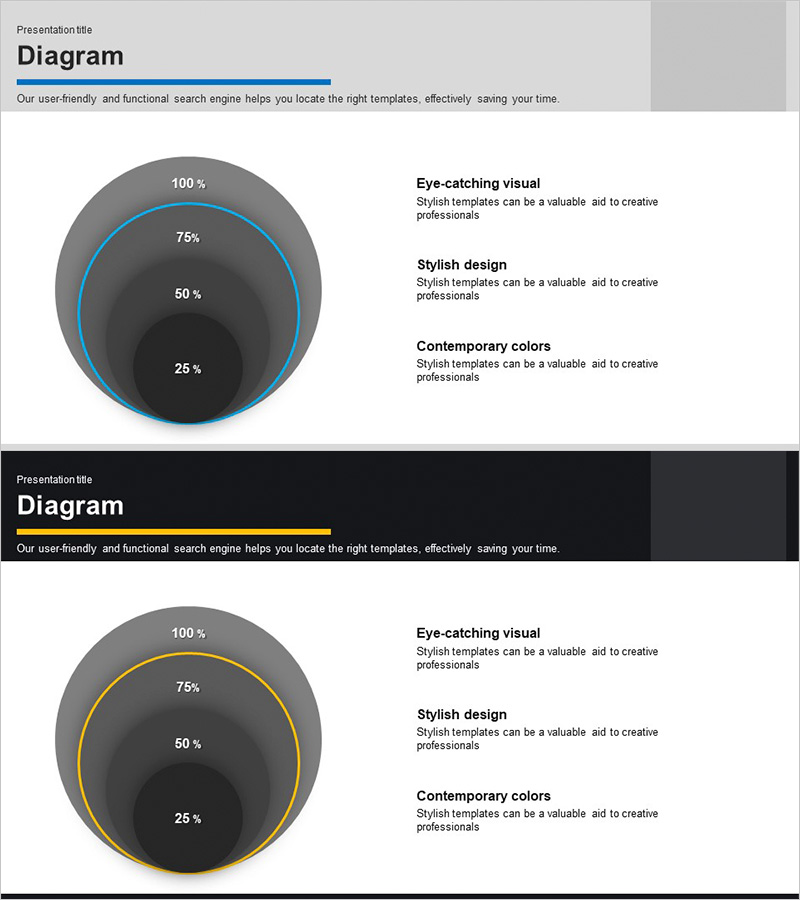
A professional concentric circle diagram PowerPoint slide optimized for market analysis and strategic planning. This multi-layer visualization extends from a central core concept outward through four distinct levels, enabling step-by-step presentation of hierarchical information and relationships. The blue and gold two-tone color scheme conveys professionalism and credibility while maintaining visual clarity. Each layer features editable text fields for immediate customization with your data, metrics, or strategic elements. Delivered as 2 slides in 16:9 widescreen format, this template integrates seamlessly into business presentations, consulting reports, marketing plans, and executive briefings.
Usage Points
-
Main Usage
Visualizes hierarchical relationships and multi-level concepts flowing from a central idea outward to supporting elements. Ideal for market segmentation, organizational structures, customer analysis, strategic frameworks, and competitive positioning where layered information and interdependencies must be communicated clearly and persuasively.
-
How to Use
Simply input your analysis categories, metrics, or strategic elements into each layer's text fields for immediate deployment. Use the innermost layer for core strategy or market overview, middle layers for tactical elements or industry segments, and outer layer for detailed execution items or competitive factors. Adapt the color coding to distinguish between different analysis dimensions or priority levels.
-
Recommended For
Executives, strategy consultants, marketing planners, business analysts, and educators presenting market analysis, business strategy, organizational hierarchies, or customer segmentation. Particularly effective for C-suite presentations, investor pitch decks, strategic planning workshops, and competitive intelligence briefings where multi-dimensional analysis must be communicated with authority.
-
Slide Structure
Four concentric circular layers with distinct text input zones at each level. Blue accent lines define layer boundaries while gold highlights emphasize key transition points. The 2-slide set allows presentation of multiple analytical scenarios or before-and-after strategic comparisons within a single deck.
Related Products
-

Customer Analysis Inclusion Diagram – Understanding Market and Strategy Development
#Market and Competitor Analysis #Diagram #Customer Analysis
-

Global Business PowerPoint Template Wide – Circular Diagram
#Operational Plan #Market and Competitor Analysis #Marketing Plan and Strategy
-

Visualizing Achievements through Design Innovation – Reflecting Latest Trends
#Business Strategy #Market and Competitor Analysis #Diagram
-

Diagram of East, West, North, and South for Business Strategy Visualization – A Creative Approach
#Business Strategy #Market and Competitor Analysis #Diagram
