Propeller Plan Overlay Circle Diagram for Strategic Flow Visualization
RJ0300009_4
- Last Update 04/20/2025
- File Size 0.1MB
- # of Slides 2
- File Format PPTX
- Slide Ratio 16:9
- Color
Keywords
- #Content-Based Slides
- #Design-Based Slides
- #Business Strategy
- #Business Management
- #Diagram
- #Implementation Plan
- #Cluster
- #Combination Diagram
- #Project Progress
- #16:9
- #monthly timeline diagram PowerPoint
- #business roadmap slide template
- #project schedule visualization
- #circular diagram slide
- #timeline PowerPoint template download
- #how to create timeline diagram in PowerPoint
About the Product
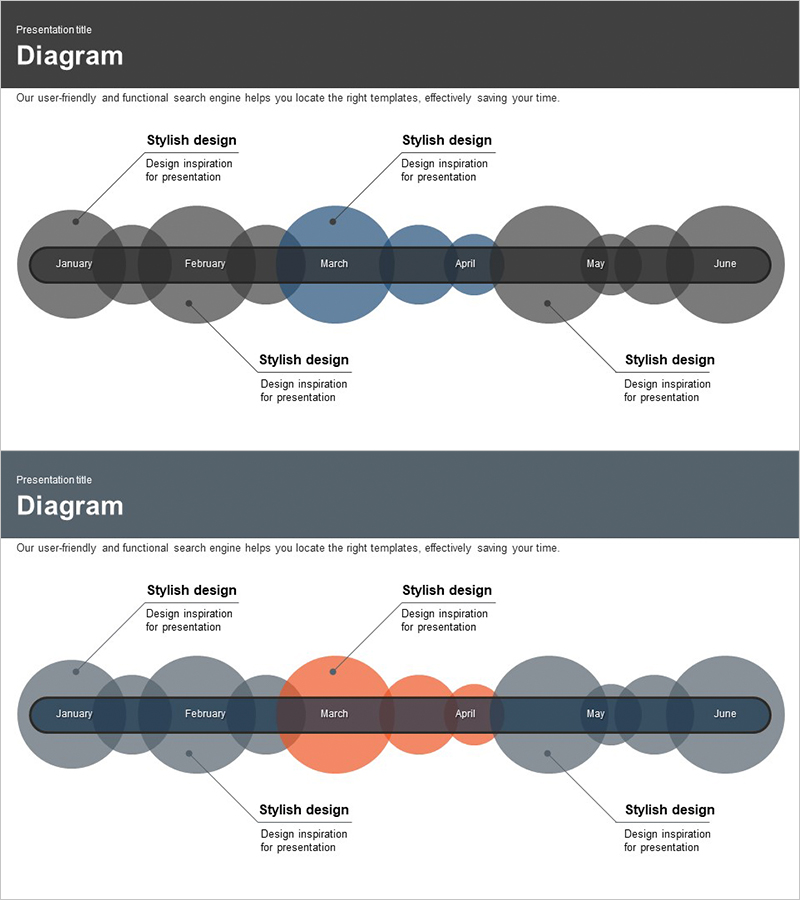
A timeline-based overlay circle diagram PowerPoint slide that visualizes business execution plans across six months from January to June. Six circular nodes are connected linearly, with each month's key milestones and activities displayed in text boxes. The design features a dark gray background with blue and orange accent color options to highlight critical phases. This presentation slide is ready to use for project management, business planning, strategic roadmaps, and executive reporting without additional design work.
Usage Points
-
Main Usage
Visualize business execution timelines and project schedules by month, clearly communicating key milestones and activities at each phase. Ideal for presenting quarterly plans, strategic initiatives, and project progress to stakeholders.
-
How to Use
Enter each month's key activities or milestones in the circular nodes. Add detailed descriptions using the text boxes above and below the timeline. Change accent colors to emphasize important phases. Use in executive briefings, team meetings, investor presentations, and strategic planning sessions.
-
Recommended For
Project managers, business planners, executives, marketing strategists, and consultants presenting business progress and timelines. Suitable for quarterly business reviews, new initiative launches, organizational change management, and strategic roadmap presentations.
-
Slide Structure
Two-slide set with identical layouts in different accent colors. First slide features blue accent highlighting March; second slide uses orange accent for the same month. Each slide displays six circular nodes in linear arrangement with text boxes positioned above and below for additional context and descriptions.
Related Products
-

Marketing Business Activity Areas Diagram – Visualizing Operations Plan
#Business Management #Operational Plan #Diagram
-

Linear Diagram Visualizing Arts and Science Progress
#Business Strategy #Business Management #Diagram
-

Partnership Business Operation Plan Slide
#Product/Service Introduction #Business Management #Technical Approach
-

Blue Orange Connection Diagram - Business Strategy
#Business Strategy #Business Management #Diagram
