Customer Service Usage Survey Slide
RJ0300009_25
- Last Update 04/20/2025
- File Size 0.3MB
- # of Slides 2
- File Format PPTX
- Slide Ratio 16:9
- Color
Keywords
- #Content-Based Slides
- #Design-Based Slides
- #Market and Competitor Analysis
- #Customer Success Stories
- #Customer Analysis
- #Customer Testimonials and Feedback
- #16:9
- #customer feedback PPT slide
- #customer survey PowerPoint
- #percentage comparison infographic slide
- #customer satisfaction survey template
- #customer analysis presentation
About the Product
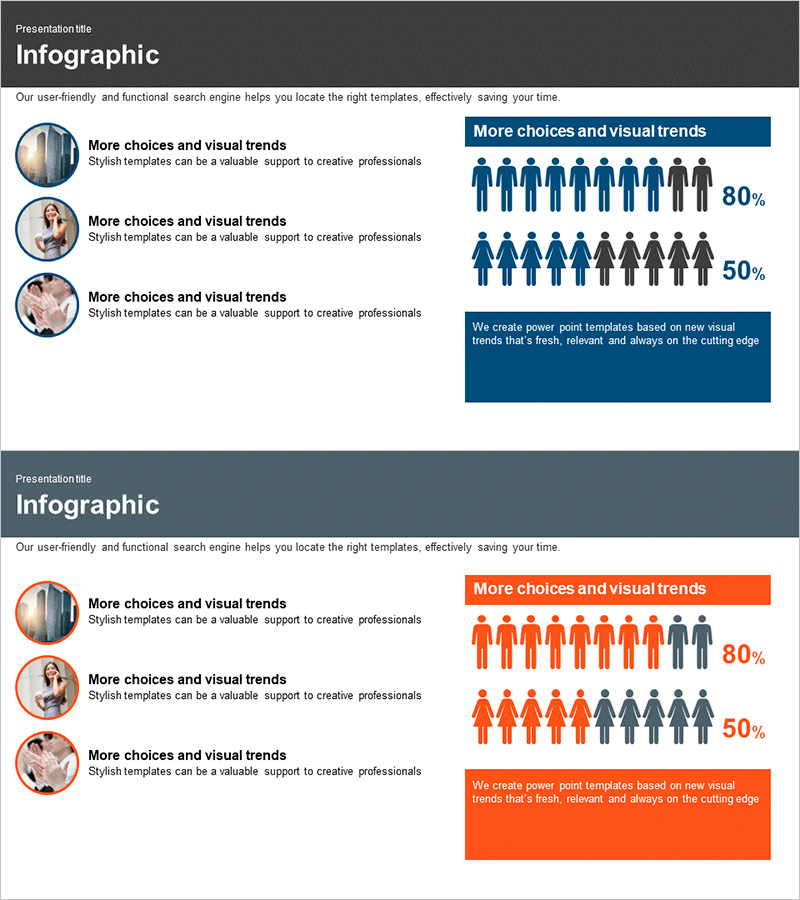
A 2-slide PowerPoint presentation designed to visualize customer service usage patterns and satisfaction metrics. The layout combines circular image placeholders on the left with percentage-based infographics on the right, enabling simultaneous display of customer profiles and statistical data. Dark gray background with navy and orange accent colors creates a professional appearance suitable for customer analysis presentations. Icons representing people, percentages, and text boxes are strategically arranged to enhance data readability. This slide deck works effectively as a PowerPoint template, presentation slide, or business report component for customer feedback analysis.
Usage Points
-
Main Usage
Present customer satisfaction surveys, analyze service usage patterns, and visualize customer feedback data with professional infographics. The left section accommodates customer profiles or images while the right section displays statistical percentages and key metrics for clear data communication.
-
How to Use
Use this slide in customer satisfaction survey presentations, service improvement meetings, and customer analysis reports. Replace placeholder text with your survey questions and percentages, insert customer photos or logos in the image areas, and customize colors to match your brand guidelines.
-
Recommended For
Marketing teams, customer service departments, executive briefings, and customer analytics presentations. Ideal for presenting customer feedback-driven decisions, service improvement strategies, and customer satisfaction trend analysis.
-
Slide Structure
Two-slide layout with navy background on slide 1 and orange background on slide 2. Each slide features three circular image input areas on the left, one title text box at the top right, and two percentage infographics (80% and 50% indicators) on the right side.
Related Products
-

Children Detail Analysis Chart – Customer Insights and Success Stories
#Market and Competitor Analysis #Customer Success Stories #Graph
-

Customer Evaluation and Feedback on Renewable Energy Business - Doughnut Chart
#Market and Competitor Analysis #Customer Success Stories #Graph
-

Optimized Template for Presentations – Efficient Information Delivery
#Market and Competitor Analysis #Customer Success Stories #Text Box
-

Consumer Analysis Graph by Age – Diagram for Enhancing Customer Insights
#Market and Competitor Analysis #Customer Success Stories #Diagram
