Eco Business Template Cover – The Start of a Sustainable Vision
RJ0300003_28
- Last Update 04/20/2025
- File Size 1.4MB
- # of Slides 2
- File Format PPTX
- Slide Ratio 16:9
- Color
Keywords
- #Content-Based Slides
- #Design-Based Slides
- #Product/Service Introduction
- #Business Introduction
- #Diagram
- #Features
- #Business Areas
- #Spread
- #16:9
- #step process diagram PowerPoint
- #4-stage flow slide design
- #process flow PPT template
- #business process diagram slide
- #how to create a process flow in PowerPoint
About the Product
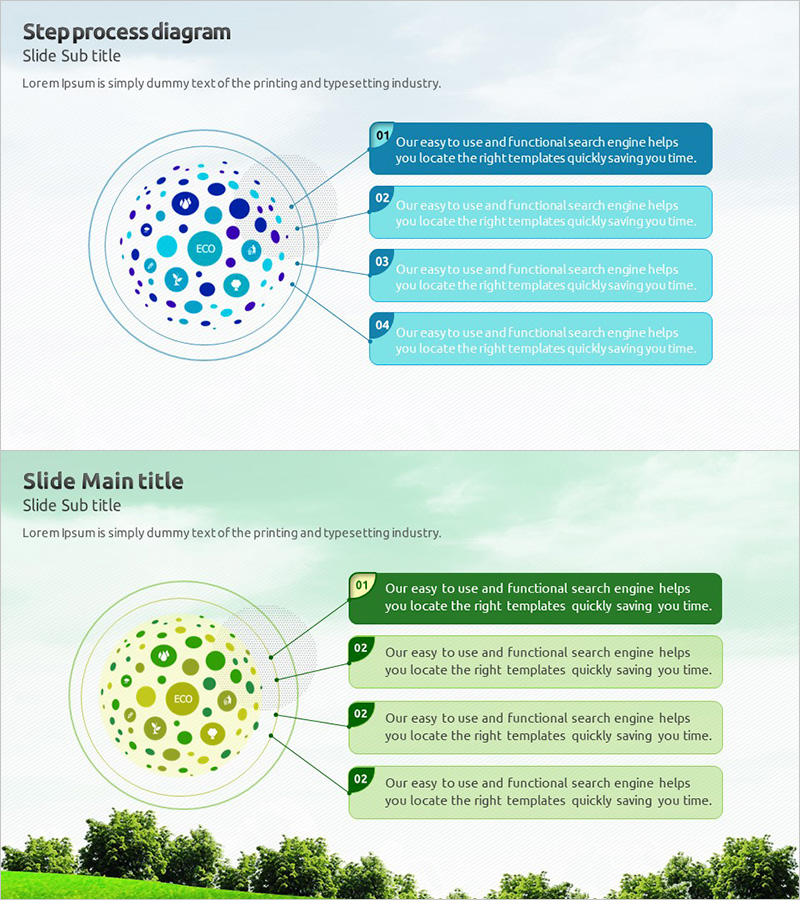
A 2-slide PowerPoint set visualizing step-by-step processes with a radial diagram structure. The central circular diagram expands into 4 stages, each with editable text boxes for descriptions. Two color versions—blue and green tones—are included to match corporate branding or presentation themes. Ideal for business processes, service workflows, strategy execution plans, and operational timelines. The radial layout makes information flow intuitive and visually engaging for stakeholder presentations.
Usage Points
-
Main Usage
Designed to break down complex business processes or service workflows into 4 distinct stages with clear visual hierarchy. The radial expansion from a central concept to surrounding stages creates intuitive information flow, making it ideal for investor pitches, partner briefings, and internal strategy communications where process clarity is critical.
-
How to Use
Enter the core concept (service name, strategy, initiative) in the central circular area, then populate the 4 surrounding text boxes with stage-specific details. Use the blue version for technology, finance, or IT presentations; choose green for sustainability, environmental, or CSR-focused topics to reinforce thematic consistency.
-
Recommended For
Business strategy presentations, new service launch announcements, project phase explanations, process improvement proposals, investment pitch decks (execution plan section), organizational change management timelines, and operational roadmap communications.
-
Slide Structure
Each slide contains a title and subtitle area, a central circular diagram with icons, and 4 numbered text boxes (01–04) positioned radially around the center. The diagram uses color-coded connections between the central element and each stage box, creating visual continuity and clear information hierarchy across the 2-slide set.
Related Products
-

Cluster Diagram of Internet Shopping Purchase Area – Ease of Purchase
#Product/Service Introduction #Business Introduction #Diagram
-

Characteristics Introduction Square Diagram – Showcasing Business Features
#Product/Service Introduction #Business Introduction #Diagram
-

Pentagon Connection Star Diagram - Cluster and Performance Introduction
#Product/Service Introduction #Business Introduction #Diagram
-

Rhombus Infographic Template for Business Area Introduction – Efficient Flow
#Product/Service Introduction #Business Introduction #Diagram
