Horizontal Bar Chart for Automotive Marketing Strategy – Simple and Stylish Design
RJ0200057_24
- Last Update 04/14/2025
- File Size 1.4MB
- # of Slides 2
- File Format PPTX
- Slide Ratio 16:9
- Color
Keywords
- #Content-Based Slides
- #Design-Based Slides
- #Product/Service Introduction
- #Marketing Plan and Strategy
- #Graph
- #Development Plan
- #Marketing Objectives
- #Horizontal Bar
- #Grouped Horizontal Bar
- #16:9
- #horizontal bar chart PowerPoint
- #automotive marketing presentation
- #bar graph slide template
- #marketing strategy slide
- #data comparison PPT slide
About the Product
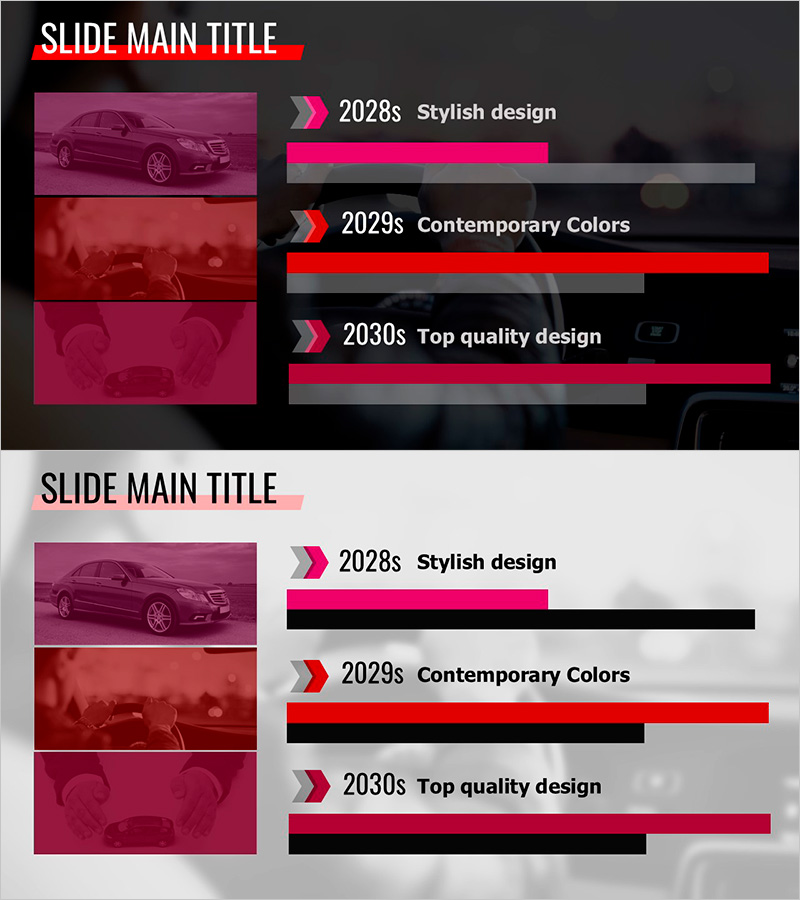
A horizontal bar chart PowerPoint slide optimized for automotive marketing strategy presentations. Set against a dark gray background, three data items are displayed in magenta, red, and wine tones side by side, enabling clear comparison of year-over-year or model-based performance metrics. The 2-slide deck includes a title slide and a data visualization slide in 16:9 widescreen format, delivered as an editable PPTX file. Designed for automotive industry marketing managers, sales directors, and business planners to communicate quantitative results such as quarterly sales volume, brand awareness, and customer satisfaction with visual clarity.
Usage Points
-
Main Usage
Communicate automotive marketing performance through quantitative comparison in presentations. Visualize year-over-year sales trends, model-based market share, regional customer satisfaction, and competitive performance benchmarks using horizontal bars that allow audiences to grasp data at a glance.
-
How to Use
Enter your presentation title on the title slide, then input actual figures into the three bar chart data fields and update the legend labels. The magenta, red, and wine color scheme can be retained or customized to match your corporate brand colors. Data can be edited directly using PowerPoint's native chart editing tools.
-
Recommended For
Recommended for quarterly performance reports at automotive manufacturers and dealerships, new vehicle launch strategy meetings, sales team achievement presentations, and customer satisfaction analysis briefings. Marketing managers, sales directors, and planning teams can use this template to support data-driven decision-making.
-
Slide Structure
Slide 1: Title slide with SLIDE MAIN TITLE text field. Slide 2: Three-item horizontal bar chart (labeled 2028s, 2029s, 2030s or model names, each bar in magenta, red, and wine tones, gray background reference lines for comparison). 16:9 widescreen format, fully editable PPTX.
Related Products
-

Marketing Objectives Layered 3D Diagram – Strategic Goal Visualization
#Product/Service Introduction #Marketing Plan and Strategy #Diagram
-

3D Circular Process for Achieving Progressive Goals
#Product/Service Introduction #Marketing Plan and Strategy #Diagram
-

Paint Splash Bar Chart Template – Market Analysis and Strategy
#Market and Competitor Analysis #Marketing Plan and Strategy #Graph
-

Arctic Business Company Internal Organization Chart – Structure and Efficiency
#Product/Service Introduction #Marketing Plan and Strategy #Diagram
