Circular Gradient Diagram for Business Goals Visualization – Connecting Strategies
RJ0200056_12
- Last Update 04/14/2025
- File Size 1.9MB
- # of Slides 2
- File Format PPTX
- Slide Ratio 16:9
- Color
Keywords
About the Product
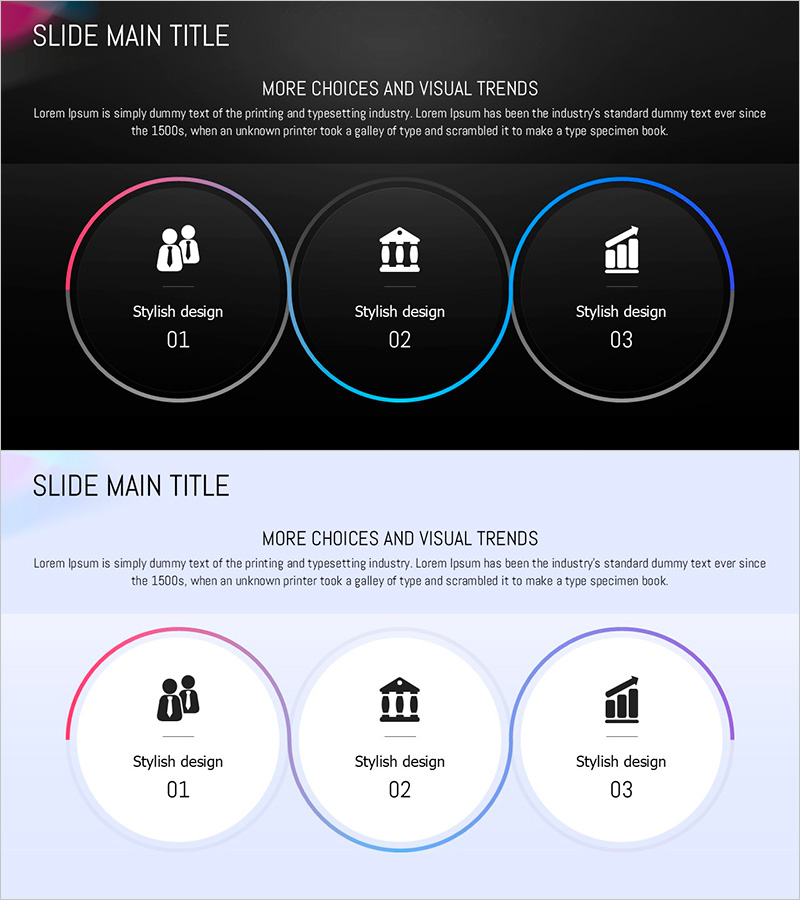
A PowerPoint slide featuring three circular nodes connected by gradient lines in a visually cohesive design. Available in two versions—dark background and light background—with pink, blue, and gray gradient borders highlighting each node. Each circle accommodates icons and editable text, making it ideal for visualizing business strategies, organizational structures, and process flows. Delivered in 16:9 widescreen format with 2 slides, ready for immediate customization and presentation.
Usage Points
-
Main Usage
Optimized for visualizing relationships and cyclical structures among three elements. Effectively communicates business goal interdependencies, departmental collaboration frameworks, and process stage flows. The gradient borders on each node enhance visual impact and audience engagement during presentations.
-
How to Use
Replace the placeholder icons and text within each circular node with your own content. Use the dark background version for executive reports and premium-focused presentations, and the light background version for bright, optimistic planning sessions. Customize node count and colors as needed for your specific requirements.
-
Recommended For
Executive reports, business strategy presentations, organizational structure explanations, process flow visualization, marketing planning pitches, project management reports, and investment pitch decks. Particularly effective when emphasizing the interconnectedness of three key elements or concepts.
-
Slide Structure
Two-slide composition featuring one dark background version and one light background version. Each slide displays three circular nodes connected by gradient lines: center node in blue gradient, left node in pink gradient, and right node in gray gradient. Each node includes dedicated icon and text input areas for flexible content integration.
Related Products
-

Key Focus Areas for Service Delivery – Effective Business Objectives Presentation
#Business Vision and Strategy #Diagram #Business Strategy
-

Connected Nested Circle Diagram – Visualizing Business Vision and Strategy
#Business Vision and Strategy #Diagram #Business Strategy
-

Business Strategies of Successful Entrepreneurs – Business Strategy Concept
#Business Vision and Strategy #Diagram #Business Strategy
-

Construction Business Characteristics Diagram - Visualizing Business Strategy and Goals
#Business Vision and Strategy #Diagram #Business Strategy
