Hologram Wide PPT Connection Diagram – Service Composition
RJ0200053_26
- Last Update 04/13/2025
- File Size 0.7MB
- # of Slides 2
- File Format PPTX
- Slide Ratio 16:9
- Color
Keywords
- #Content-Based Slides
- #Design-Based Slides
- #Technical Approach
- #Diagram
- #Service Configuration Plan
- #System Architecture Diagram
- #Cluster
- #Chain Diagram
- #16:9
- #connection diagram PowerPoint
- #service architecture slide
- #system composition diagram
- #9-node diagram PowerPoint
- #organizational structure slide
- #gradient background diagram
- #how to create connection diagram in PowerPoint
About the Product
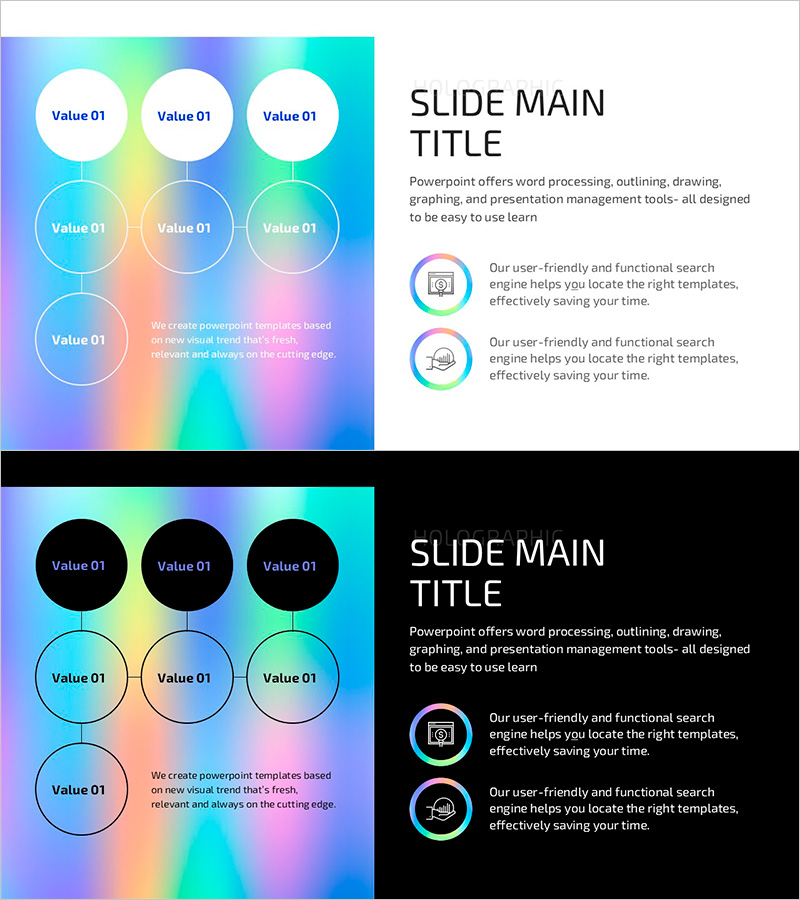
A connection diagram PowerPoint slide featuring 9 nodes arranged in a 3×3 grid on a gradient hologram background. Three circular nodes at the top, three in the middle, and one large node at the bottom are connected by vertical lines to visualize service composition, system architecture, and organizational hierarchy. The vibrant gradient background blending blue, green, pink, and orange creates visual depth, while white and black nodes provide clear contrast for information hierarchy. Two-slide set includes a light background version and a dark background version for flexible presentation environments. Each node accepts text input for immediate customization of departments, functions, or process stages. Built with PowerPoint native shapes for easy color, size, and connector line modifications.
Usage Points
-
Main Usage
Visualizes service composition, system architecture, organizational hierarchy, process flow, and interdepartmental relationships. Text input in each node specifies departments, functions, or stages, while connector lines clarify relationships and dependencies between components.
-
How to Use
Apply to organizational chart sections in company profile presentations, technical architecture pages in product brochures, operational system explanations in business plans, channel structure diagrams in marketing proposals, and solution architecture descriptions in pitch decks. Double-click nodes to edit text, duplicate nodes for expansion, or add connectors to extend the structure as needed.
-
Recommended For
IT and software companies presenting technical documentation, consulting firms proposing organizational restructuring, financial institutions illustrating system architecture, manufacturing companies showing process flows, educational institutions explaining department structures, and startups presenting team composition and role assignments.
-
Slide Structure
Slide 1: Light gradient hologram background (blue, green, pink, orange) with 9 white circular nodes in 3×3 grid connected by vertical lines. Slide 2: Black background with identical structure using black nodes and colored borders. Each node includes 'Value 01' text input area; description text area positioned on the right side of both slides.
Related Products
-

Hexagon Connection Infographic – Technology and Service Composition
#Technical Approach #Diagram #Service Configuration Plan
-

Diagram Slide Visualizing Payment System Configuration Contents
#Product/Service Introduction #Technical Approach #Diagram
-

Real Estate Business Marketing Diagram – Innovative Systems Design
#Technical Approach #Diagram #System Architecture Diagram
-

Business Area Connection 3D Diagram – Emphasizing Technical Integration
#Business Introduction #Technical Approach #Diagram
