Car Wide Template Diagram2 – Business Area Visualization
RJ0200044_8
- Last Update 04/10/2025
- File Size 2.8MB
- # of Slides 2
- File Format PPTX
- Slide Ratio 16:9
- Color
Keywords
About the Product
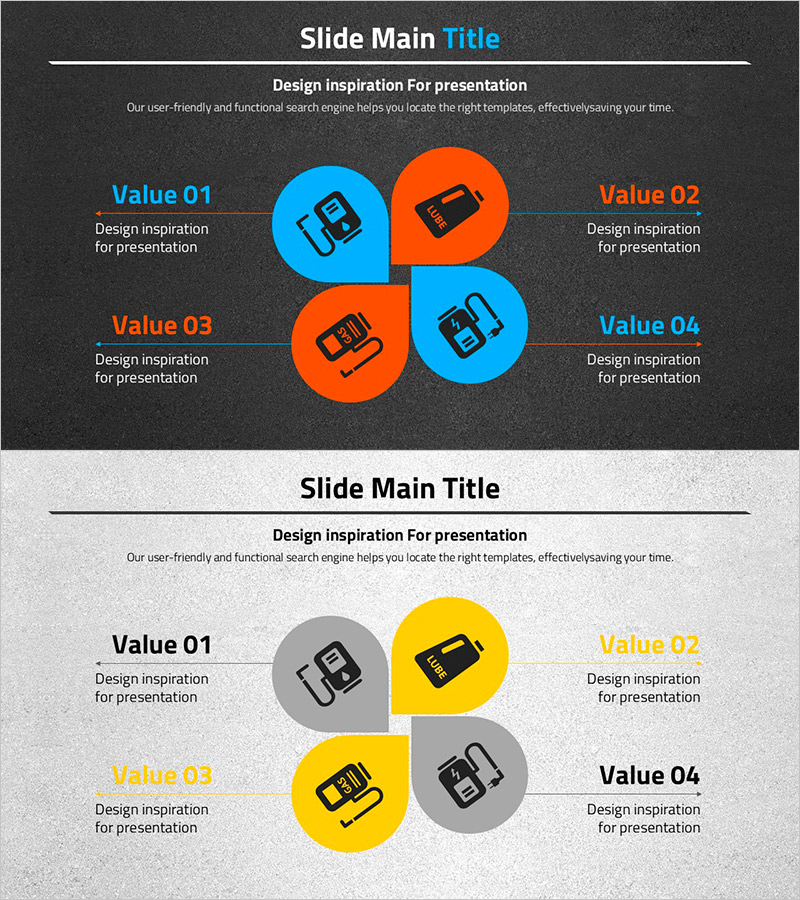
A centerless diagram PowerPoint slide featuring four circular nodes arranged in a cross pattern. Blue and orange colors alternate to emphasize the independence and equal importance of each area. Ideal for visualizing business domains, product lines, organizational departments, or strategic axes in parallel. Includes icons and text labels for immediate use, with fully editable colors and text. Supplied in 16:9 widescreen format across 2 slides, ready to integrate into presentations, business plans, and reports.
Usage Points
-
Main Usage
Use this slide to compare and explain four equal elements side by side. Effective for business domain analysis, product portfolio presentation, organizational structure, strategic axes, customer segmentation, or market classification where four items must be displayed simultaneously without a central focus.
-
How to Use
Enter title and description text in each circular node, and replace icons as needed. Colors can be adjusted to match your brand palette, and node size and arrangement are fully customizable. Insert into presentation slides, business plans, or report sections.
-
Recommended For
Ideal for strategy planning teams, marketing departments, business development units, organizational restructuring managers, and product managers. Recommended for business portfolio explanations, market segmentation, organizational redesign presentations, strategic axis proposals, and customer classification materials.
-
Slide Structure
2-slide set. First slide features a dark background (charcoal gray) with four blue and orange circular nodes in cross arrangement. Second slide uses a light background (light gray) with the same structure in alternate colors (gray and yellow). Each node includes icon, label, and text description area.
Related Products
-

SNS Business Circular Diagram - A Symbol of Collaboration and Growth
#Company Introduction #Business Introduction #Diagram
-

8 Key Concepts for Visualizing Business Vision
#Business Introduction #Business Vision and Strategy #Diagram
-

Key Strategies Folded into Four Action Plans
#Product/Service Introduction #Business Introduction #Diagram
-

Experimental Area Description Slide - Analysis and Visualization
#Company Introduction #Business Introduction #Diagram
