Paint Splash Infographic Template – Technology Status Overview
RJ0200040_8
- Last Update 04/09/2025
- File Size 4.1MB
- # of Slides 2
- File Format PPTX
- Slide Ratio 16:9
- Color
Keywords
About the Product
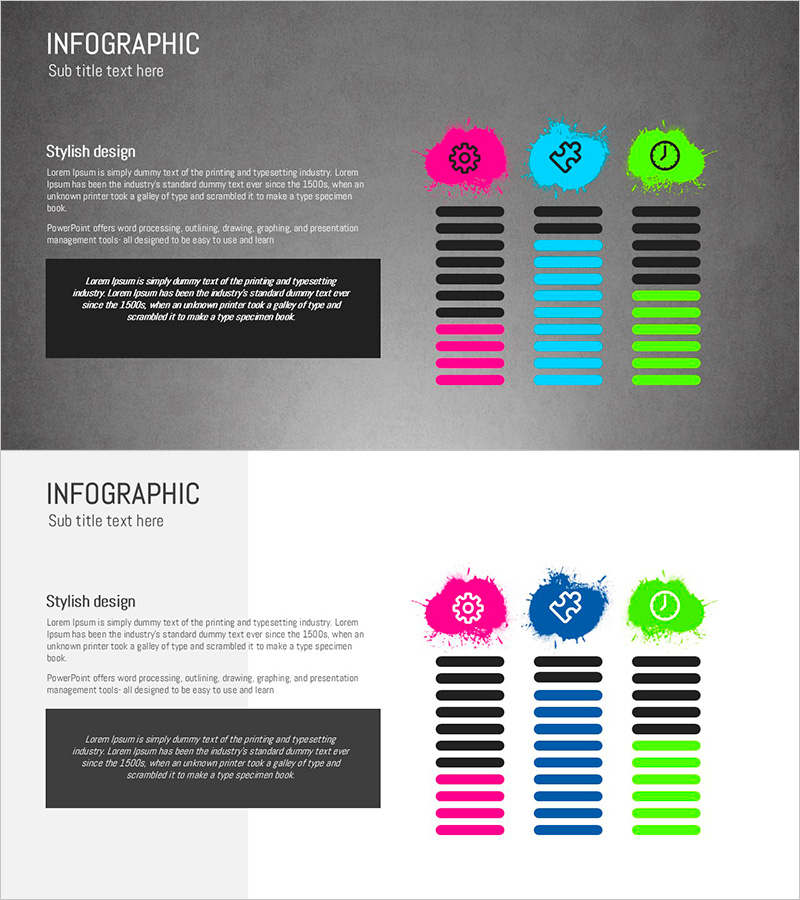
A visually compelling infographic PowerPoint slide designed to diagnose and communicate technology status across three key areas. Features paint splash icons in pink, cyan, and lime green paired with horizontal bar charts, enabling side-by-side comparison of technology characteristics. The left text area accommodates detailed descriptions, while the right three-column layout presents each technology domain's level, current status, and strategy in parallel structure. Fully editable 2-slide PPTX template ready for immediate use in technology presentations, business overviews, and technology assessment reports.
Usage Points
-
Main Usage
Diagnose and compare technology status across multiple domains using visual infographic structure. The three-column parallel layout clearly presents technology level, current status, and strategy for each domain, supporting data-driven decision-making. Ideal for technology presentations, business overviews, and technology assessment reports where technology landscape clarity is critical.
-
How to Use
Enter technology overview, background, and strategic context in the left text box. Customize the three right-column sections by replacing domain names, updating bar chart values, and adding domain-specific descriptions. Maintain or adjust the pink, cyan, and lime color scheme to align with your presentation branding and technology categories.
-
Recommended For
Technology officers, CTOs, and technology strategy teams presenting technology status to executives, investors, and partners. Effective for new technology adoption reviews, technology roadmap development, and competitive technology analysis where domain-level capability visualization is essential.
-
Slide Structure
Two-slide layout with contrasting backgrounds: dark gray and white. Each slide features a left text input area and right three-column infographic structure. Each column contains a paint splash icon (pink, cyan, or lime), domain title, and horizontal bar chart, creating a three-tier information hierarchy for clear technology domain comparison.
Related Products
-

Camping Business Marketing Goal Diagram
#Business Introduction #Diagram #Technological Status
-

Sports Infographic Strategy Diagram – Vision and Competitiveness
#Business Introduction #Business Vision and Strategy #Diagram
-

Magic Performance Guide Diagram – An Engaging and Creative Business Introduction
#Business Introduction #Diagram #Business Areas
-

Football Strategy Slide – Business Introduction and Vision
#Business Introduction #Business Vision and Strategy #Diagram
