Paint Splash Template Diagram – Business Direction Presentation
RJ0200040_24
- Last Update 04/09/2025
- File Size 3.7MB
- # of Slides 2
- File Format PPTX
- Slide Ratio 16:9
- Color
Keywords
- #Content-Based Slides
- #Design-Based Slides
- #Business Strategy
- #Operational Plan
- #Diagram
- #Business Direction
- #Production and Technology Development Strategy
- #Structure
- #Pyramid Chart
- #16:9
- #pyramid diagram PowerPoint slide
- #3-level structure presentation
- #dual-side comparison diagram
- #business strategy PowerPoint
- #operational planning slide template
About the Product
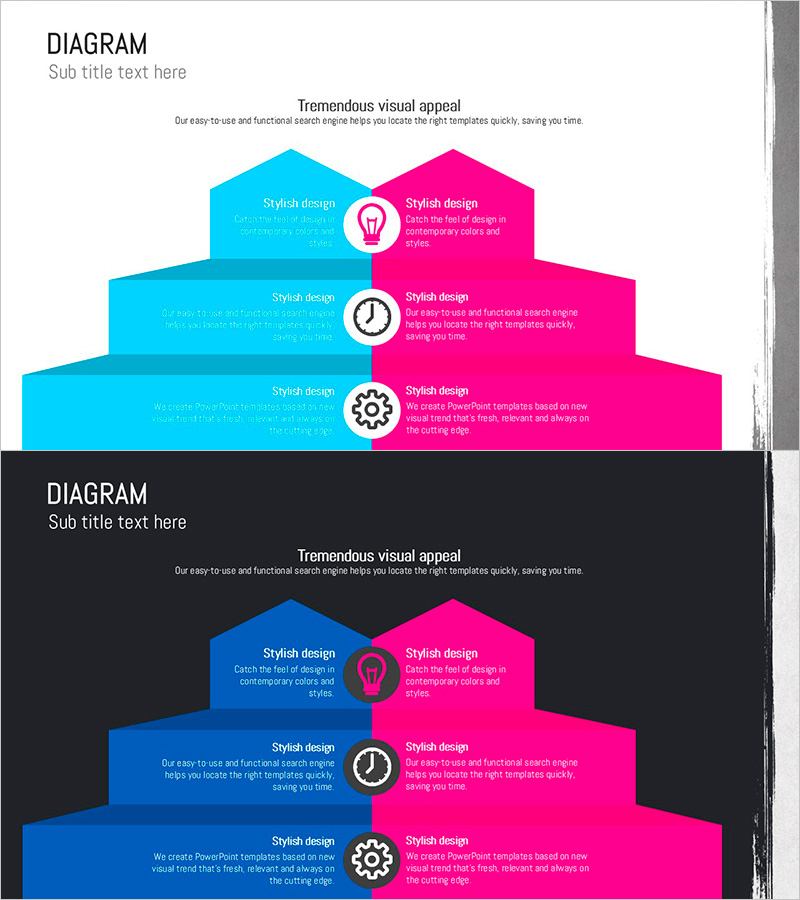
A 3-level pyramid diagram PowerPoint slide designed to visualize business direction and operational planning with striking dual-side contrast. The left side features cyan tones while the right side displays hot magenta, creating an effective comparison layout. Each level includes centered icons (lightbulb, clock, gear) to emphasize information hierarchy and guide audience focus. This 16:9 widescreen 2-slide template is ready for immediate use in strategy presentations, business plans, and executive reports.
Usage Points
-
Main Usage
Effectively communicate multi-stage business strategies, operational plans, and implementation roadmaps using a left-right comparison framework. The centered icons highlight key elements at each level, while the contrasting color scheme (cyan vs. magenta) makes comparative relationships immediately clear to your audience.
-
How to Use
Deploy this slide in the strategy section of your presentation to explain phased business objectives and execution plans. Position current state or problems on the left, and solutions or goals on the right. Alternatively, use it to contrast legacy processes against new initiatives. Simply replace placeholder text with your specific content to create a customized presentation.
-
Recommended For
Ideal for executives, planning teams, marketing departments, and sales teams presenting business strategies, quarterly operational plans, or new project initiatives. Particularly effective for comparative presentations such as current vs. improved processes, existing vs. new solutions, or baseline vs. target metrics.
-
Slide Structure
3-level pyramid structure divided into left and right sections. Each level contains: left text area (cyan background) + centered icon (lightbulb, clock, or gear) + right text area (magenta background). Two identical slides provided for flexible content expansion.
Related Products
-

Eco-friendly Eco Business Direction Blue Gray Slide
#Business Strategy #Diagram #Text Box
-

Business Process Overview Template – Innovation and Execution
#Business Strategy #Operational Plan #Technical Approach
-

Key Business Outcomes & Future Strategy Slide – Capturing Business Direction
#Business Strategy #Diagram #Business Direction
-

Architectural Management Strategy Presentation – Strategic and Structural Approach
#Business Strategy #Operational Plan #Diagram
