Horizontal Bar Segmentation Graph for Business Plan - Strategic Marketing Approach
RJ0200027_25
- Last Update 04/05/2025
- File Size 2.3MB
- # of Slides 2
- File Format PPTX
- Slide Ratio 16:9
- Color
Keywords
- #Content-Based Slides
- #Design-Based Slides
- #Business Strategy
- #Marketing Plan and Strategy
- #Graph
- #Roadmap
- #Marketing Strategy
- #Horizontal Bar
- #Segmented Horizontal Bar
- #16:9
- #horizontal bar chart PowerPoint
- #segmentation chart template
- #business plan slide
- #marketing strategy presentation
- #data comparison slide
- #bar graph template
About the Product
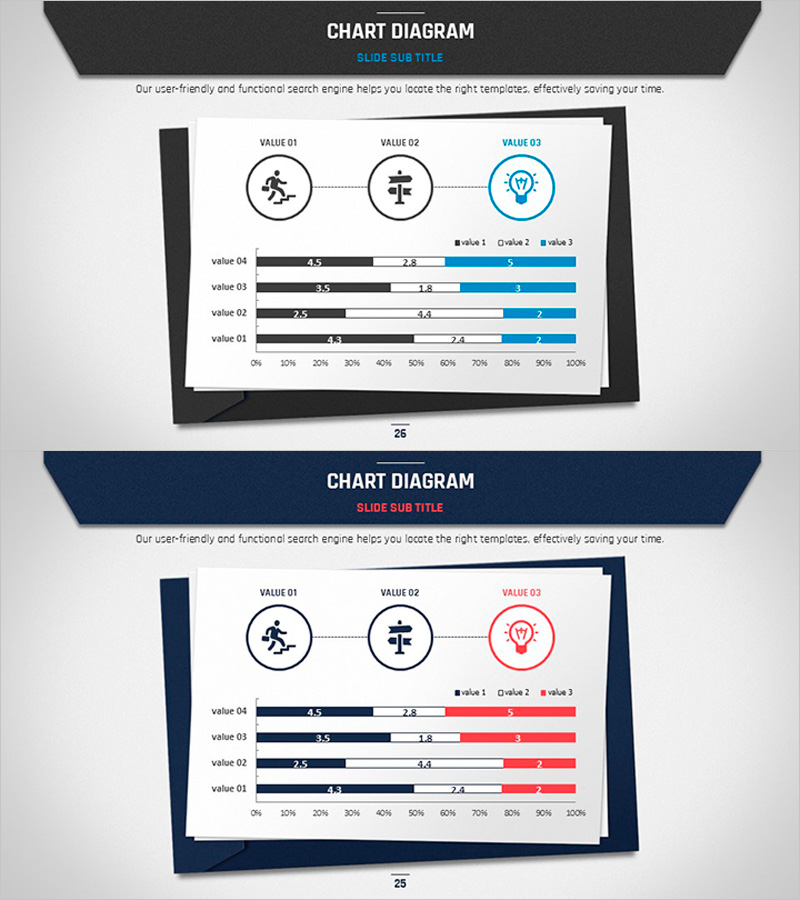
A horizontal bar segmentation chart PowerPoint slide designed for business planning and marketing strategy presentations. This template visualizes 4 items (Value 01–04) divided into 3 data series, clearly showing the compositional ratio of each item. The chart uses three color tones—black, blue, and gray—to distinguish series, with a 3-step process diagram (icons + connecting lines) positioned above to represent strategic flow. The 2-slide set includes color variations (black/blue background vs. white background) for flexible presentation environments. Fully editable PPTX format (16:9 aspect ratio).
Usage Points
-
Main Usage
Visualize compositional ratios across 3 data series for comparative analysis. Ideal for business planning stages including market segmentation, customer analysis, product portfolio composition, and marketing budget allocation.
-
How to Use
Enter strategic phases in the process diagram at the top, then input numerical data for each item in the horizontal bars below. Adjust series colors according to the legend (value 1, 2, 3) and select between 2 design variations to match your presentation background.
-
Recommended For
Marketing managers, strategy planning teams, sales directors, and business development professionals. Perfect for presentations explaining market analysis, customer segmentation, product line comparisons, and budget allocation.
-
Slide Structure
Top section: 3-step process diagram with 3 circular icons and dotted connectors. Bottom section: 4-row × 3-series horizontal bar chart (0–100% scale with legend). 2-slide set with black/blue/gray tone variations.
Related Products
-

Growth Strategy PowerPoint Slide – Hub Market & 6-Month Plan
#Business Strategy #Marketing Plan and Strategy #Diagram
-

Split Bar Graph and Pill Shape Diagram – Highlighting Marketing Strategy
#Market and Competitor Analysis #Marketing Plan and Strategy #Diagram
-

Visually Represented AI Marketing Goals in a Cluster Slide
#Marketing Plan and Strategy #Diagram #Marketing Objectives
-

Optimal Female Shoe Height Slide – Style and Success Together
#Product/Service Introduction #Marketing Plan and Strategy #Benefits and Advantages
