Closed Diagram for Business Strategy Visualization – Effective Business Progress Explanation
RJ0200020_12
- Last Update 04/02/2025
- File Size 7.3MB
- # of Slides 2
- File Format PPTX
- Slide Ratio 16:9
- Color
Keywords
About the Product
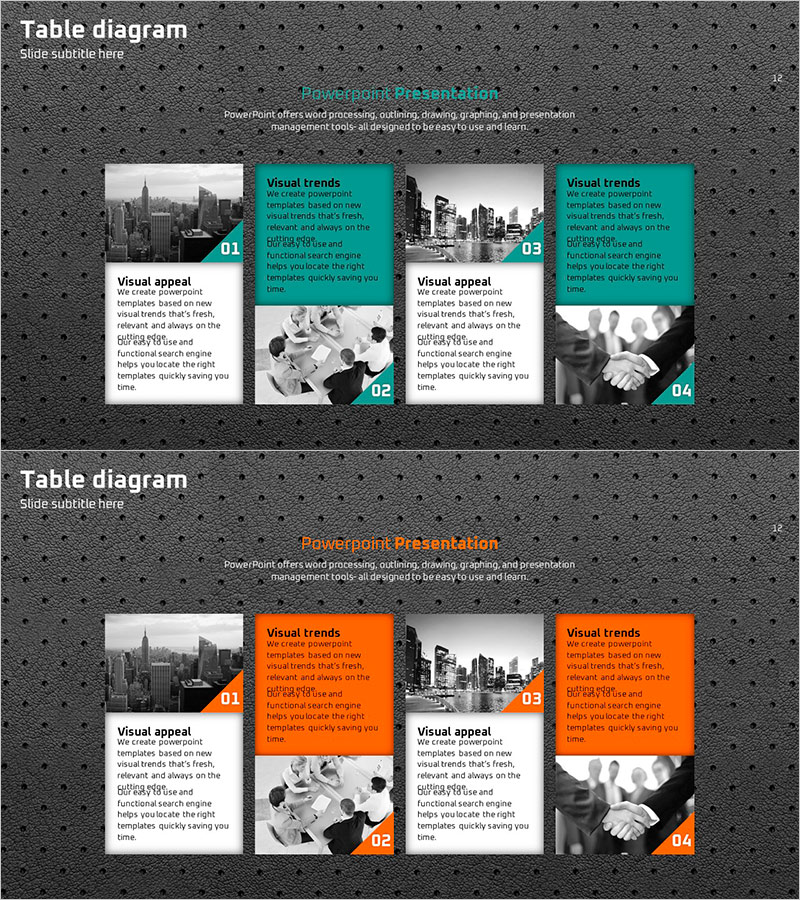
A 4-section closed diagram PowerPoint slide designed to clearly present business strategy progress and project milestones. Set against a dark gray background, each section features a turquoise or orange accent box that distinguishes key content at every stage. The layout contrasts black-and-white images on the left with color images on the right, creating strong visual impact. Each section includes title, description, and numbered labels for efficient information delivery. This PPT template is ready to use for business progress reports, marketing campaign timelines, project milestones, and strategic presentations.
Usage Points
-
Main Usage
Ideal for presenting business strategy progression, project phases, marketing campaign roadmaps, and organizational change processes across four distinct stages. The diagram combines text descriptions with visual imagery in each section, enhancing audience comprehension and engagement throughout the presentation.
-
How to Use
Replace the title and description text in each section with your own content. Swap the left black-and-white images and right color images with project-related photographs. Adjust the turquoise or orange accent box colors to match your corporate brand identity while maintaining the numbered sequence to emphasize step-by-step progression.
-
Recommended For
Recommended for executive and board presentations on business progress, marketing team campaign status updates, project manager milestone explanations, new business strategy presentations, and organizational change management briefings. Particularly effective for internal reports and external presentations where stage-by-stage progress must be emphasized.
-
Slide Structure
Two-slide set with each slide divided into four equal sections. Each section features an image area on the left (black-and-white or color), paired with a turquoise or orange accent box and text input area on the right. Numbered labels (01–04) indicate progression stages. Formatted in 16:9 widescreen ratio for modern presentation environments.
Related Products
-

Effective Information Delivery with Striped Text Box
#Product/Service Introduction #Diagram #Text Box
-

Shooting Plan Slide Template – Effective Business Strategy
#Business Strategy #Diagram #Step-by-Step Schedule Plan
-

Timeline of Animal Music Activities Visualized in a Diagram Slide
#Company Introduction #Business Strategy #Diagram
-

Aerobic Exercise after Strength Training Diagram – Business Strategy Direction
#Business Strategy #Diagram #Business Direction
