Cluster Overlap Diagram for Visualizing Product Features – Harmony of Blue and Green
RJ0200019_4
- Last Update 04/02/2025
- File Size 7.2MB
- # of Slides 2
- File Format PPTX
- Slide Ratio 16:9
- Color
Keywords
- #Content-Based Slides
- #Design-Based Slides
- #Product/Service Introduction
- #Diagram
- #Features
- #Cluster
- #Combination Diagram
- #Chain Diagram
- #16:9
- #cluster overlap diagram PowerPoint
- #5-stage diagram slide template
- #product features visualization
- #cluster diagram template download
- #how to create cluster diagram in PowerPoint
About the Product
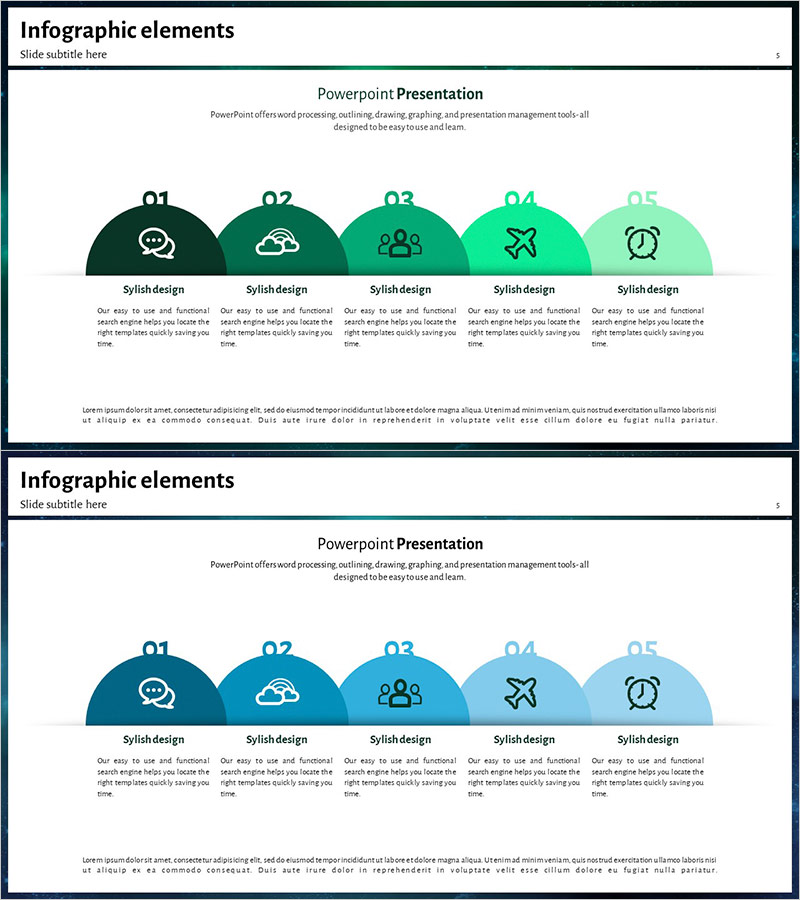
A PowerPoint slide that visualizes product features and characteristics through five overlapping semicircular cluster areas with a gradient color scheme from dark green to mint. Each section includes space for icons and descriptive text, creating a hierarchical information structure. This presentation template is ideal for product introductions, service feature breakdowns, and functional classifications, ready to use immediately in business decks and marketing materials.
Usage Points
-
Main Usage
Organizes and displays five key product or service characteristics through overlapping semicircular clusters. The nested structure simultaneously conveys hierarchical relationships and progressive expansion, making it suitable for functional categorization, market positioning, organizational structures, and strategic framework visualization.
-
How to Use
Input titles and descriptions into each semicircular area and replace icons to represent different categories. The color gradient automatically suggests priority and progression, allowing seamless integration into product introduction slides, marketing plans, business proposals, and information organization sections.
-
Recommended For
Product managers, marketing professionals, and business presenters who need to communicate product features clearly. Ideal for startup pitch decks, product brochures, corporate proposals, educational seminar materials, and any presentation requiring hierarchical information organization.
-
Slide Structure
Two-slide layout. The first slide features five semicircular clusters (dark green, green, mint, light mint, bright mint) radiating from center with icons and text boxes beneath each area. The second slide offers an alternative version with the same structure but using a dark blue gradient color scheme for variety.
Related Products
-

Effectively Organized Fountain Pen Business Promotion Slide
#Product/Service Introduction #Business Management #Diagram
-

Idea Analysis System – Product/Service Differentiation Strategy
#Product/Service Introduction #Operational Plan #Diagram
-

Direction Diagram by Sector – Visualizing Business Strategy
#Business Strategy #Diagram #Production Plan
-

Children's Media Diagram – Infusing Creativity and Fun
#Product/Service Introduction #Diagram #Features
