Marketing Strategy Visualization via Diagram – Simple Circle Template
RJ0200013_9
- Last Update 04/01/2025
- File Size 0.5MB
- # of Slides 2
- File Format PPTX
- Slide Ratio 16:9
- Color
Keywords
- #Content-Based Slides
- #Design-Based Slides
- #Technical Approach
- #Marketing Plan and Strategy
- #Diagram
- #Service Implementation Plan
- #Marketing Strategy
- #Spread
- #Centralized Diagram
- #16:9
- #radial diagram PowerPoint
- #marketing strategy presentation
- #hub-and-spoke diagram slide
- #business process visualization
- #organizational structure PowerPoint template
About the Product
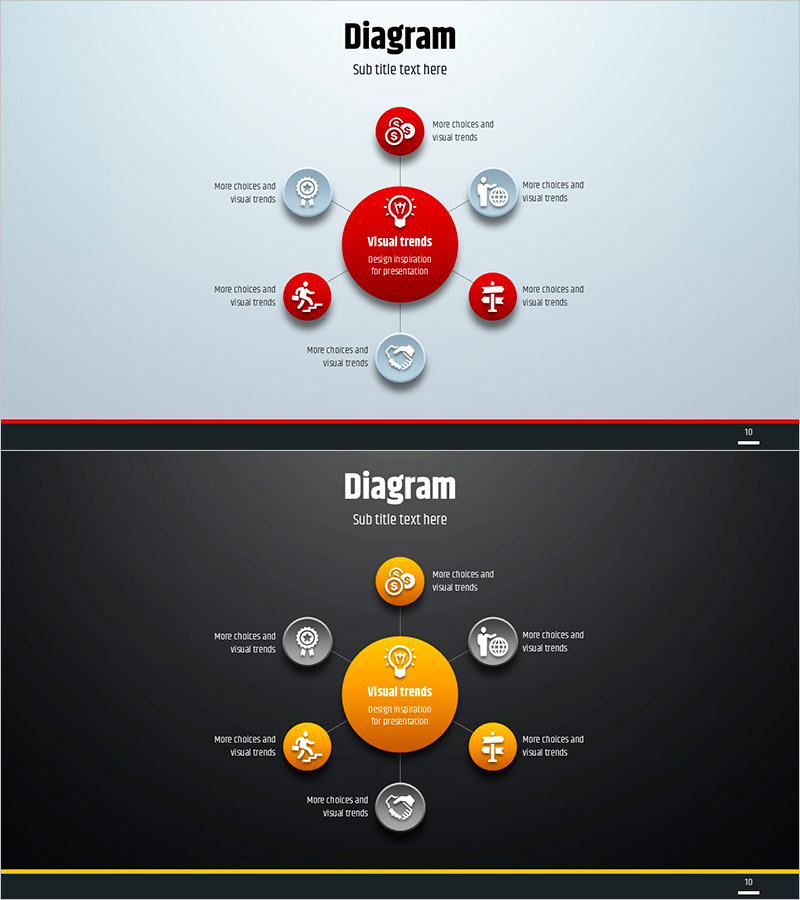
A radial diagram PowerPoint slide that expands from a central concept to six surrounding elements, ideal for visualizing marketing strategies, business processes, and organizational roles. The design features a light background with red and orange circular nodes at the center and gray supporting nodes for hierarchy representation. Each node includes space for icons and editable text fields. This 16:9 widescreen 2-slide template is ready for immediate use in presentations, strategy reports, and business proposals.
Usage Points
-
Main Usage
Presents core marketing concepts and execution elements in a radial pattern, enabling intuitive understanding of overall strategy structure. The hub-and-spoke visual hierarchy clearly demonstrates layered relationships and interconnections across six directional branches.
-
How to Use
Use in strategy overview presentations, marketing planning document sections, and executive briefings on key initiatives. Customize each node's text and icons to represent organizational roles, project phases, customer touchpoints, or any multi-element concept requiring hierarchical visualization.
-
Recommended For
Marketing professionals, strategy planning teams, executive presenters, consulting firms, and educators who need to communicate complex concepts clearly and concisely. Suitable for startup pitches, corporate strategy meetings, and academic presentations.
-
Slide Structure
Slide 1: Light background with central red circular node (icon + editable text area) connected to six surrounding nodes in cardinal and diagonal directions (gray and red circles, each with icon + text field). Slide 2: Black background version with identical structure and orange central node for color variation. All nodes are fully editable shapes.
Related Products
-

Safety Management System Diagram – Operational Planning and Technical Support
#Operational Plan #Technical Approach #Diagram
-

Diagram Slide Visualizing Characteristics of Sofa Types
#Product/Service Introduction #Technical Approach #Diagram
-

Geometry PowerPoint Template Wide Diagram6 – Optimized for Marketing Strategy & Target Market
#Technical Approach #Marketing Plan and Strategy #Diagram
-

Central Poster Slide for Korean Traditional Music
#Business Vision and Strategy #Technical Approach #Diagram
