Blue Green Donut Highlight Chart – Market Insights with Visual Appeal
RJ0200012_7
- Last Update 04/01/2025
- File Size 1.7MB
- # of Slides 2
- File Format PPTX
- Slide Ratio 16:9
- Color
Keywords
- #Content-Based Slides
- #Design-Based Slides
- #Company Introduction
- #Market and Competitor Analysis
- #Graph
- #Shareholder Structure
- #Market Share
- #Circles
- #Doughnut Chart
- #16:9
- #donut chart PowerPoint slide
- #pie chart template
- #ratio visualization
- #market share graph
- #competitive analysis PPT
- #donut graph download
About the Product
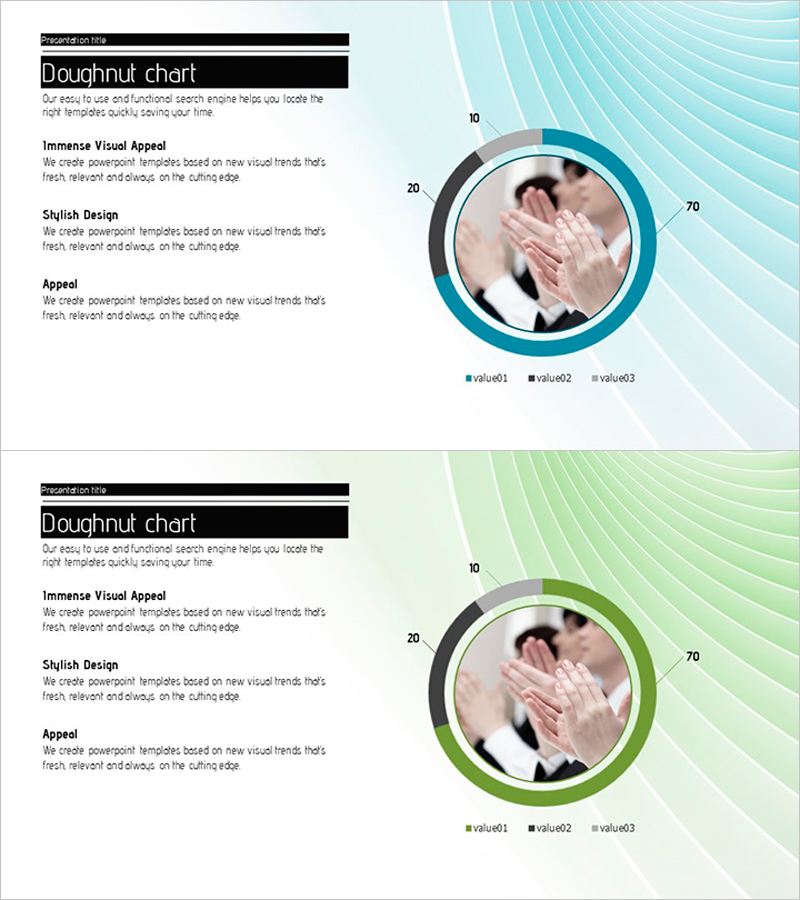
A donut chart PowerPoint slide designed for market share and competitive analysis presentations. This 2-slide template features a blue and green gradient background with a centered circular image area that emphasizes key data. The right side displays a three-segment donut chart showing proportional data, while the left side provides text space for analysis and insights. The 16:9 widescreen PPTX format is fully editable and ready to use in business presentations, financial reports, and data-driven analysis materials.
Usage Points
-
Main Usage
Clearly display proportional relationships between data segments using a donut chart format. Ideal for visualizing market share, customer composition, budget allocation, sales distribution, and other ratio-based metrics. The centered image area allows you to emphasize key messages or product photography.
-
How to Use
Enter your analysis title and description in the left text box, then update the donut chart values and legend to match your data. Insert product images or related visuals in the centered circular area to enhance visual impact. Adjust the gradient background and chart colors to align with your corporate branding.
-
Recommended For
Recommended for marketing teams presenting market analysis, sales departments explaining customer composition, finance teams reporting budget allocation, and executives presenting business performance. Suitable for quarterly reports, competitive benchmarking presentations, and new product launch strategy meetings.
-
Slide Structure
2-slide layout with left text area (title and 3-line description) and right donut chart (3 segments with sample 10-20-70 ratio). The centered circular image area features adjustable transparency to reveal the gradient background. Two color versions provided: blue tone and green tone variants.
Related Products
-

Market Share Analysis Using Donut Chart – Geometric Design
#Company Introduction #Market and Competitor Analysis #Graph
-

Red Blue Donut Chart Analysis – Visualizing Market Share
#Company Introduction #Market and Competitor Analysis #Graph
-

Watercolor Customer Analysis Donut Chart – Visualizing Market Share
#Market and Competitor Analysis #Graph #Market Share
-

Travel Business Competitor Analysis and Market Share – Doughnut Chart Based
#Market and Competitor Analysis #Graph #Market Share
