Five Color PowerPoint Template Wide – Bilateral Bar Graph Comparison
RJ0200009_21
- Last Update 03/30/2025
- File Size 4.6MB
- # of Slides 2
- File Format PPTX
- Slide Ratio 16:9
- Color
Keywords
- #Content-Based Slides
- #Design-Based Slides
- #Market and Competitor Analysis
- #Graph
- #Market Analysis
- #Target Market
- #Horizontal Bar
- #Double Horizontal Bar
- #16:9
- #bilateral bar chart PowerPoint
- #two-way comparison slide template
- #competitive analysis presentation
- #market comparison chart
- #how to create comparison chart in PowerPoint
About the Product
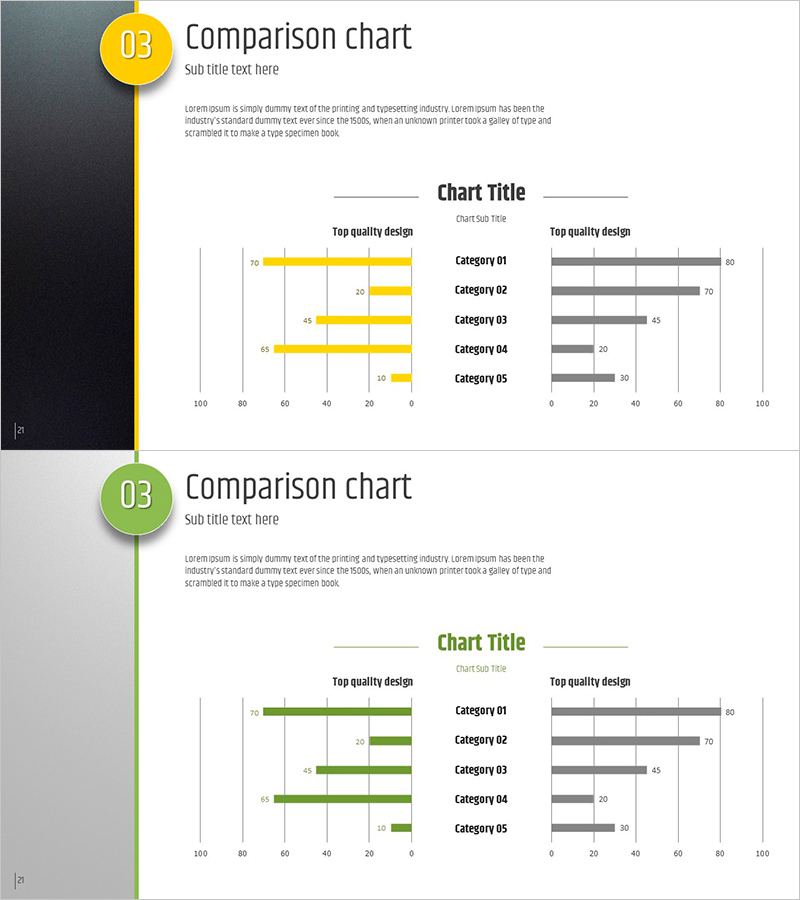
A bilateral bar chart PowerPoint slide that extends in both directions for side-by-side comparison. This slide template features 5 categories displayed symmetrically left and right, making it ideal for competitive analysis, market comparison, and feature contrast presentations. The design uses a yellow and gray two-tone color scheme to emphasize contrast, with numeric labels on each bar for immediate presentation use. Provided as a 2-slide set in 16:9 widescreen format, all text and data values are fully editable.
Usage Points
-
Main Usage
Presents two groups of data side-by-side using a symmetric bilateral bar structure for intuitive comparison. Ideal for competitive analysis, market benchmarking, product feature comparison, and performance evaluation in any presentation requiring contrastive analysis.
-
How to Use
Enter data values for 5 categories into the left yellow bars and right gray bars respectively. Customize the title and legend to match your presentation context, and freely adjust colors and numeric labels. Ready to apply directly to executive reports, marketing strategy presentations, and sales proposals.
-
Recommended For
Recommended for marketing, sales, and executive reporting professionals who need to present quantitative comparisons. Particularly effective for strategy development, decision-making meetings, and client proposals where two subjects must be compared objectively.
-
Slide Structure
2-slide set featuring bilateral bar charts on each slide. Each slide includes 5 category bars (left yellow, right gray) with numeric labels, title area at top, and legend section. All elements including data, colors, and labels are fully customizable.
Related Products
-

Idea Presentation Template Wide Bilateral Bar Graph
#Market and Competitor Analysis #Graph #Market Analysis
-

Analysis of US Target Regions – Slide Template for Market and Competitor Analysis
#Market and Competitor Analysis #Graph #Other
-

Bilinear Bar Graph Analysis by Scientific Field - A New Paradigm in Data Visualization
#Market and Competitor Analysis #Graph #Competitor Analysis
-

Bar Chart Analysis of Causes of Marital Conflict
#Market and Competitor Analysis #Graph #Customer Analysis
